 @datascience@genomic.social
2026-01-27 11:00:00
Im using case_when() quite a lot, case_match() is new to me: #rstats
@datascience@genomic.socialIm using case_when() quite a lot, case_match() is new to me: #rstats
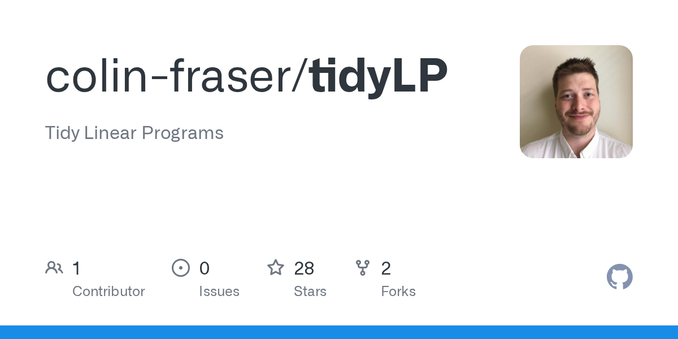
@datascience@genomic.socialLinear programs help to find optimal solutions based on a set of constrains. I used {ompr} before, but the new package {tidyLP} looks promising and integrates with the tidyverse. #rstats #linearprograms #optimization
@datascience@genomic.social @datascience@genomic.socialAll the talks from rstudio::conf 2022: https://www.rstudio.com/conference/2022/2022-conf-talks/ 👩🏫 Keynotes: https://www.
 @datascience@genomic.social
Are you making slides with Quarto or R Markdown and need a timer e.g. for breaks or group work? There is the {countdown} package for you: #rstats
@datascience@genomic.social @datascience@genomic.social @datascience@genomic.socialThe fastverse is a suite of complementary high-performance packages for statistical computing and data manipulation in R. #rstats
@datascience@genomic.socialKeynote from rstudio::conf 2022: The past and future of shiny. #rstats
@datascience@genomic.socialThere are many situations were you need access to different R versions: rig is a way to manage them #rstats
@datascience@genomic.socialCustomize what happens when you start R: #rstats #environment
 @Gord1i@fosstodon.org
Low key product launch to end the year: https://cct-development-management-bot.cct-datascience.xyz/index.html
It's a long story, but we've put out a very niche RAG bot relating to development management in
@datascience@genomic.social"Graphic Design with #ggplot2": All material from this 2 day workshop can be found at https://rstudio-conf-2022.github.io/ggplot2-graphic-design/
@datascience@genomic.socialNot sure any longer which libraries your script actually needs? #rstats
@datascience@genomic.social @datascience@genomic.socialDo you (sometimes) use print() or message() for debugging your code? Next time you can use {icecream} instead: #rstats
@datascience@genomic.social @datascience@genomic.socialYou dont like the default color palett of #ggplot? You can change it: https://stackoverflow.com/questions/10504724/change-the-default-colour-palette-in-ggplot
@datascience@genomic.social{slider} helps with aggregation over (sliding) windows, both index and time period based: #rstats
@datascience@genomic.social @datascience@genomic.social @datascience@genomic.social @datascience@genomic.socialA pictures says more than 1000 words. How much more can an audio representation of your data tell you? #rstats
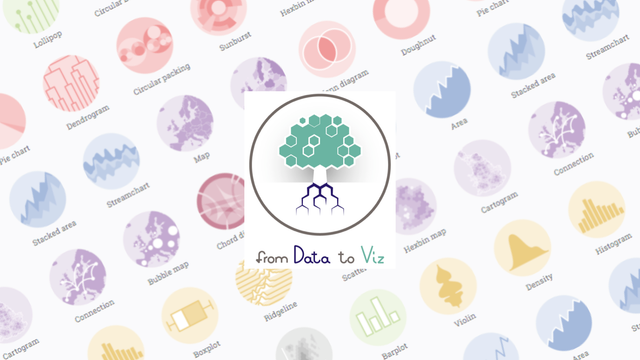
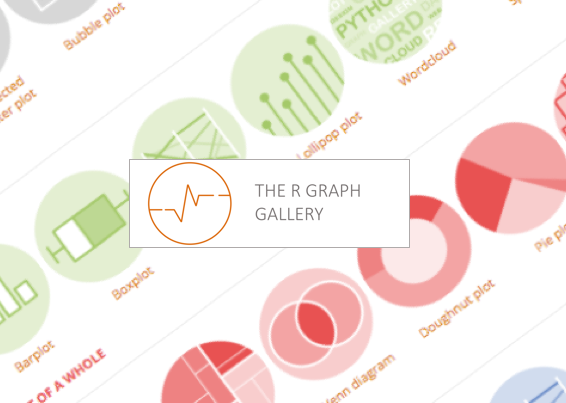
@datascience@genomic.socialDo you need inspiration how to present a dataset in a clear figure and what package to use? Check out #rstats
@datascience@genomic.social @datascience@genomic.socialThe {esquisse} package makes it easy to plot your data in different ways with a drag and drop interface: #rstats
@datascience@genomic.socialWant to check the google trends for a topic? Use {gtrendsR} directly from within your favorite language: #googletrends
@datascience@genomic.socialA curated list of awesome tools to assist 📦 development in R programming language. #rstats #📦
@datascience@genomic.socialVideo tutorials for modern ideas and open source tools. #python
@datascience@genomic.socialIf you just need a pretty figure from a dataset and not the full power of R, have a look at #gui
 @lukascbossert@mastodon.social
How nice @… made it into #researchdatamanagement. Also #Coscine (developed at
@datascience@genomic.socialThe functions in the {withr} package allow to change your environment temporarily. E.g. create a temp file for a {testthat} test and clean it up afterwards. #rstats
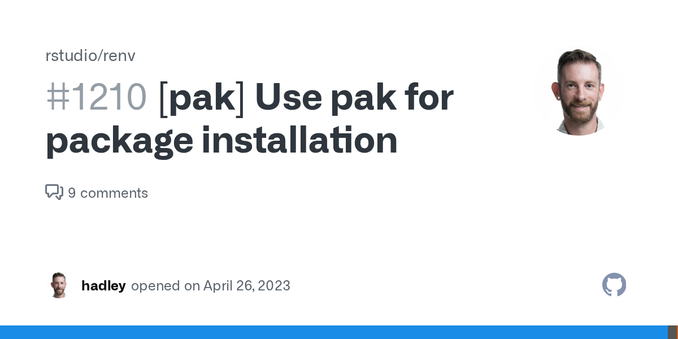
@datascience@genomic.social @datascience@genomic.socialWant to use {pak} as backend for {renv} actions? Set the variable RENV_CONFIG_PAK_ENABLED = TRUE #renv
@datascience@genomic.socialThe {purrr} package is a powerfull way to replace loops. The {furrr} package takes this approach one step further by parallel execution: #rstats
@datascience@genomic.socialCute comics of R functions by @…: https://allisonhorst.com/r-packages-functions
@datascience@genomic.social @datascience@genomic.socialDiscover the power of property-based testing in R with the #quickcheck package! Seamlessly integrates with #testthat and offers a variety of generators for atomic vectors, lists, and tibbles. Perfect for ensuring your code's reliability. Check it out:
@datascience@genomic.socialIts good to have many tests in your R package, but it can be a pain to debug some failing tests when it happens. {lazytest} for the rescue: only rerun the failing tests, until they pass: #RStats
@datascience@genomic.social @datascience@genomic.socialMake sure your code follows a consitent style using the {lintr} package. #rstats
@datascience@genomic.social @datascience@genomic.socialAdd richer tooltips to ggiraph with kableExtra and friends: #dataviz
@datascience@genomic.social @datascience@genomic.socialUse multi level models with {parsnip}: http://multilevelmod.tidymodels.org/ #rstats #ML
@datascience@genomic.social @datascience@genomic.social @datascience@genomic.socialThe inner working of parquette/arrow data in R: #rstats
@datascience@genomic.social @datascience@genomic.socialDo you have a long running calculation freezing up your shiny app? {callr} or {crew} might help: https://discindo.org/post/asynchronous-execution-in-shiny/
@datascience@genomic.social{dtrack} makes documentation of data wrangling part of the analysis and creates pretty flow charts: #rstats
@datascience@genomic.socialR doesnt need to be a hard and scientific tool 📈. You can use it to make art 🎨: #rstats
@datascience@genomic.social @datascience@genomic.social @datascience@genomic.socialAdd highlighting to your quarto presentation using the RoughNotation library: #rstats
@datascience@genomic.socialFunction-oriented Make-like declarative workflows for R #rstats
@datascience@genomic.socialFriends Don't Let Friends Make Bad Graphs! Do you agree with the examples of bad graphs and the alternatives Chenxin Li (@chenxinli2.bsky.social) lists at https://github.com/cxli233/FriendsDontLetFriends
@datascience@genomic.socialAre you interested in how dependency-heavy your (or another) package is and why? #rstats
@datascience@genomic.socialA template for data analysis projects structured as R packages (or not) https://github.com/Pakillo/template by @…
@datascience@genomic.social @datascience@genomic.socialUsing fonts in R graphics can be tricky at times. {showtext} aims to make it easier: #rstats
@datascience@genomic.socialThere are frameworks like {golem} and {rhino} to make shiny development more robust, but I like the concept of {shinytest2} in providing a testing framework for pure shiny. https://rstudio.github.io/shinytest2/index.html
@datascience@genomic.socialLets be honest, we spend too much time cleaning data. {janitor} can help with that: #rstats #datasciece
@datascience@genomic.socialYet another cool and useful package from @…: {minixml} lets you build xml files in a programmatic way. I see good use for it in one of the internal packages at work... https://coolbutu…
@datascience@genomic.socialBeside the {report} package (yesterdays note) there are more tools in the easystats collection. #rstats
@datascience@genomic.socialEasier debugging of piped analyses in R: https://github.com/MilesMcBain/breakerofchains by @…
@datascience@genomic.socialNeed some data to test a plot idea or algorithm? On #rstats #synthetic…
@datascience@genomic.socialAutomatically describe data and models as text using the {report} package. #rstats
@datascience@genomic.socialIf you set limits for a scale (e.g. x-axis) in ggplot, how would you like data outside of that range be handled? There is the oob parameter for that and a set of functions to use with it: https://scales.r-lib.org/reference/oob.html
@datascience@genomic.socialSometimes you get data in less than optimal format, e.g. as a png of a figure 😭... In that case https://cran.r-project.org/web/packages/metaDigitise/vignettes/metaDigitise.html might be the rescue.
@datascience@genomic.socialSometimes you need to know the exact color used in a picture, or you might want to make a pallet from a foto. Check out {eyedroppeR} by @…: https://gradientdescending…
@datascience@genomic.social @datascience@genomic.socialFind the best contrast between one color and a list of options, e.g. for labels in geom_tile: {prismatic::best_contrast()} https://emilhvitfeldt.github.io/prismatic/reference/best_contrast.html
@datascience@genomic.social @datascience@genomic.social @datascience@genomic.social @datascience@genomic.socialPolars is a lightning fast DataFrame library/in-memory query engine with parallel execution and cache efficiency. And now you can use is with the tidyverse syntax: #rstats
@datascience@genomic.socialAdd some swag to your ggplots, with fontawesome symbols and colors: #rstats
@datascience@genomic.socialDo you need better performance than what the standard #tidyverse functions have? {collapse} might be worth a look: https://sebkrantz.github.io/collapse/
@datascience@genomic.social @datascience@genomic.social @datascience@genomic.socialIf you use Quarto to make presentations for a professional setting, it is important to choose the right theme, e.g. #rstats
@datascience@genomic.social{piggyback} makes it easier to attach large files (e.g. input data) to code in github repos: #rstats
@datascience@genomic.social{purrr} has some lesser known functions that make handling of failing function calls easier: safely, quietly, possibly: #rstats
@datascience@genomic.socialTidyX: screencasts explaining different aspects of the R language and the coding process. #rstats
@datascience@genomic.socialPrimer to get you started with Optimization and Mathematical Programming in R #rstats
@datascience@genomic.socialInteractive resizing of picture and table content in Rmd and Quarto: #rstats
@datascience@genomic.socialI did not know about ggplot_build() before. It can come in handy in situations where you want to access computed metrics of a #ggplot. https://ggplot2.tidyverse.org/reference/ggplot_build.html…
@datascience@genomic.socialFollow along when @… walks you through how she tackles a new dataset: https://www.youtube.com/c/JuliaSilge
@datascience@genomic.socialThe {conflicted} package makes sure that namespace conflicts are solved explicitly and prevents unpleasent surprises: #rstats
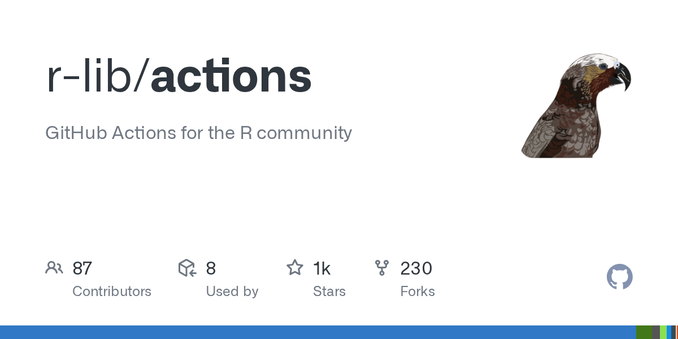
@datascience@genomic.socialGitHub Actions for the R language: Makes automatic testing of your R package much easier and making sure your package works on different OS and R versions is a matter of just a few lines of yaml: #rstats
@datascience@genomic.social{ggblanket}, a wrapper around #ggplot for quick, explorative plots with sensible defaults and less code. https://davidhodge931.github.io/ggblanket/
@datascience@genomic.socialI have a habbit of making (too) many (small) packages for functionality that might be reused in different context. {box} might be an alternative by making scripts into modlues that can be loaded: #RStats <…
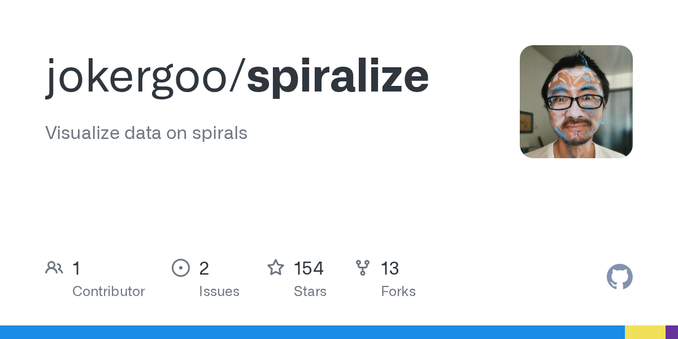
@datascience@genomic.social{spiralize} can be used to highlight cyclic data, e.g. multi year time series. #rstats