 @arXiv_csHC_bot@mastoxiv.page
2026-08-12 08:20:59
ResonaVis: Visualizing Interactive Music Data to Support Reflective Music Composition for Therapeutic Contexts
Abhishek Karwankar, Elise Ruggiero, Daniel Stevens, Matthew Louis Mauriello
https://arxiv.org/abs/2608.10338 https://arxiv.org/pdf/2608.10338 https://arxiv.org/html/2608.10338
arXiv:2608.10338v1 Announce Type: new
Abstract: Designing music for therapeutic contexts requires navigating complex relationships between musical structure and listeners' sensory responses, yet composers often lack structured representations of these interactions, relying instead on intuition. We present ResonaVis, an interactive visualization system that helps composers analyze interaction and audio data from prior sessions with children with Autism Spectrum Disorder (ASD), informing future compositions. ResonaVis integrates audio features and interaction logs to capture how children engage with layered musical compositions, representing this engagement through coordinated visualizations of temporal transitions, layer co-occurrence, rhythmic activity, and spectral characteristics. Rather than prescribing strategies or supporting therapy sessions directly, the system surfaces patterns in past session data to support data-informed reflection during composition. We evaluated ResonaVis through a mixed-methods study with eight music students and a follow-up case study with two experienced composers. Results demonstrate good usability (SUS = 72.23), exceeding benchmarks for early prototypes, and show that participants could identify interaction patterns, reason about layer relationships, and make informed compositional decisions with high perceived performance and low frustration. Confidence in interpreting interaction and acoustic data for ASD-focused composition increased significantly across multiple dimensions (p < 0.05), with qualitative findings suggesting a shift toward more adaptive, data-informed composition. This work contributes a visualization design space for therapeutic music interaction data, an integrated system for compositional reflection, and empirical evidence that visualization tools support analytical reasoning and confidence in data-informed creative practice. (Abstract shortened for arXiv.)
toXiv_bot_toot
 @underdarkGIS@fosstodon.org
2026-09-29 18:52:58
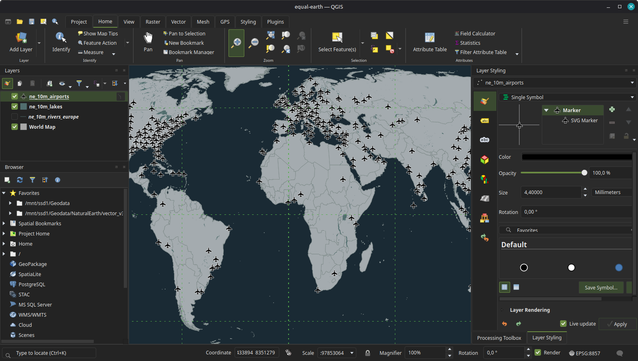
QGIS tabbed ribbon UI experiments
A long-standing feature request in the QGIS repo has been an option for a ribbon-style GUI to replace the plethora of toolbars that usually characterize the top rows of any QGIS window.
A couple of months ago Eithan published an experimental "Ribbon Toolbar" plugin for QGIS 3 that implemented a first version of this idea. I recently picked up the threads, ported the plugin to QGIS 4 and continued …
 @Erikmitk@mastodon.gamedev.place
2026-09-21 18:07:51
“We are not going back to the early internet. Nor should we romanticise it. The old web had plenty of sewage. What it also had was space beyond the market. A person could make something without becoming a brand. A conversation could end without a conversion. A community could exist without turning its members into marks for an investment scheme.”

 @frankel@mastodon.top
2026-09-16 18:19:47
A Java Geek weekly 154
Choosing a dependency. European Union Public Licence. Rust debugging survey 2026 results. Comparing TSV and CSV formats. Call14 — Smart Elevator Companion. Ma stack de service logiciels pour construire des produits. OTel Collector metrics: how to monitor Collector health. What Should Programmers Do While the AI Writes Code?. What will our economic future look like?. Why Code Quality Still Matters in the Age of AI Agents and more