 @Sustainable2050@mastodon.energy
2025-12-06 21:07:19
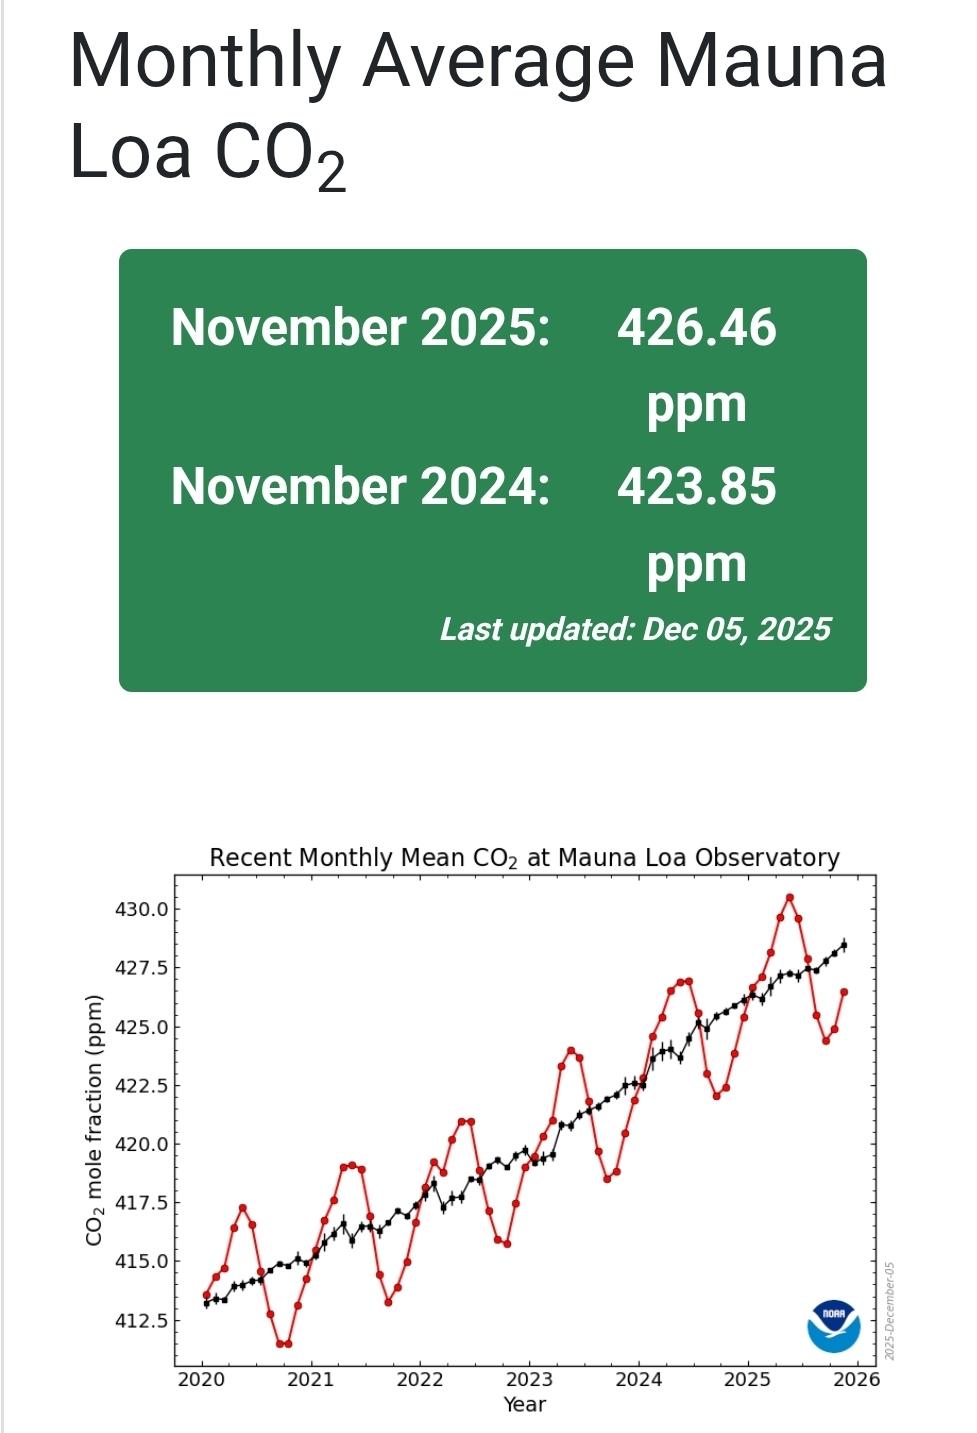
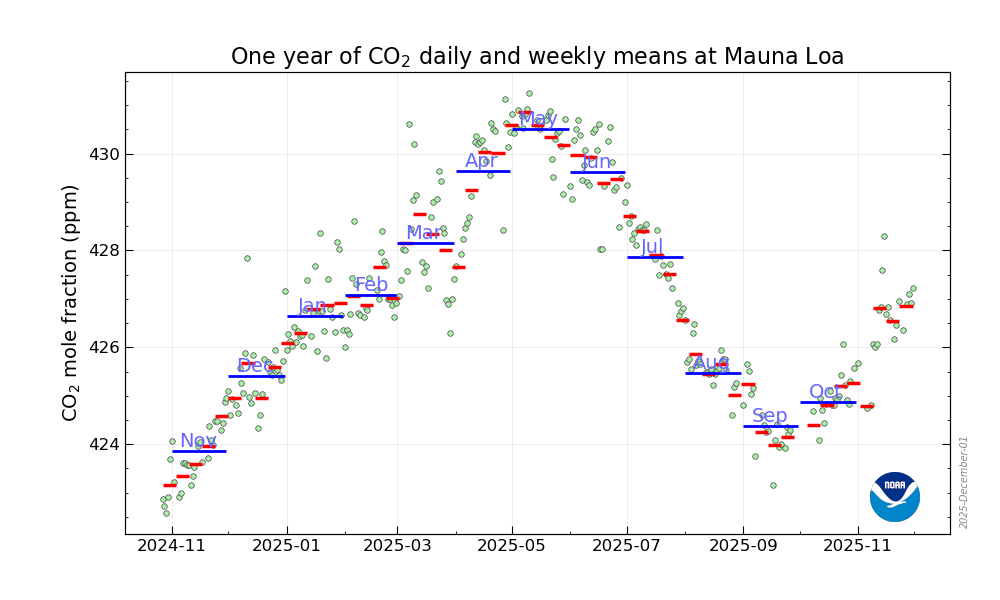
Confirmed: Another big jump in atmospheric CO2, (still) measured at Mauna Loa: the November average was ~426.5 ppm, that's 2.6 ppm higher than last year!
 @Sustainable2050@mastodon.energy
Confirmed: Another big jump in atmospheric CO2, (still) measured at Mauna Loa: the November average was ~426.5 ppm, that's 2.6 ppm higher than last year!
 @mxp@mastodon.acm.org
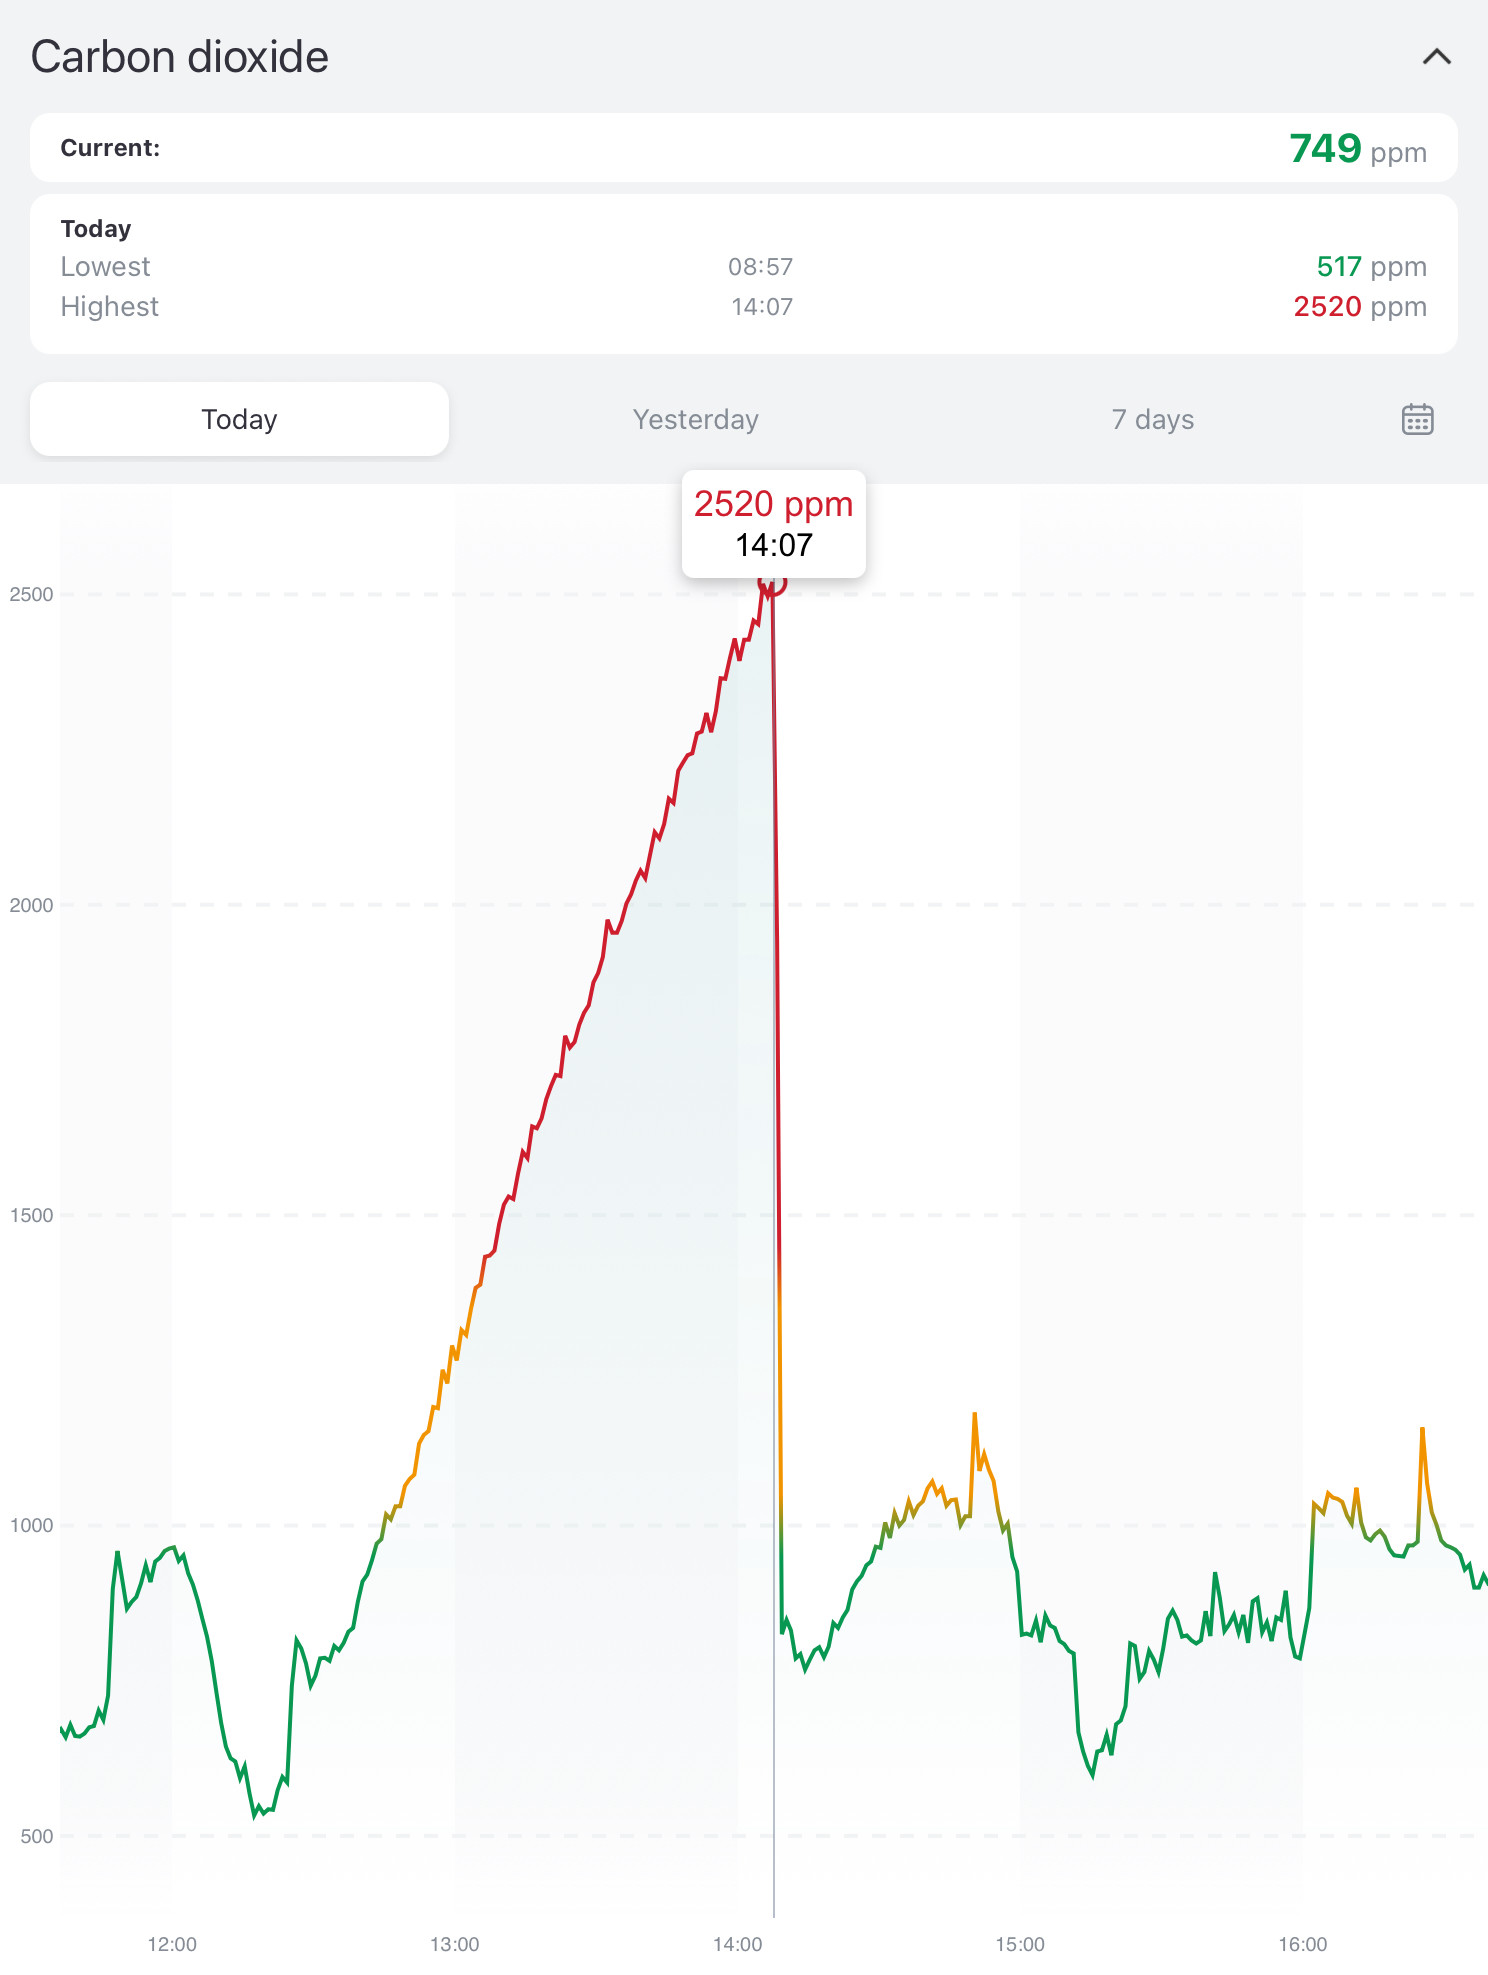
@… Yes, I’ve got an aranet 4 with me.
FV-Dosto, upper deck 1st class, almost at capacity is between 1200 and 1500 ppm. This is quite typical. The ventilation is far from adequate, even if you're just concerned about the CO₂.
 @penguin42@mastodon.org.uk
netpbm tools are a suite of tools to convert and fiddle with the ppm/pbm/pgm (collectively pnm) file formats, which are pretty much the simplest image formats on the planet, which even have an ASCII version; so if you have a simple script you want to generate simple images with they're a good choice of format, and if you have them, the pbm tools can convert to/from pretty much anything else or do simple scale/etc - lighter than ImageMagick say.
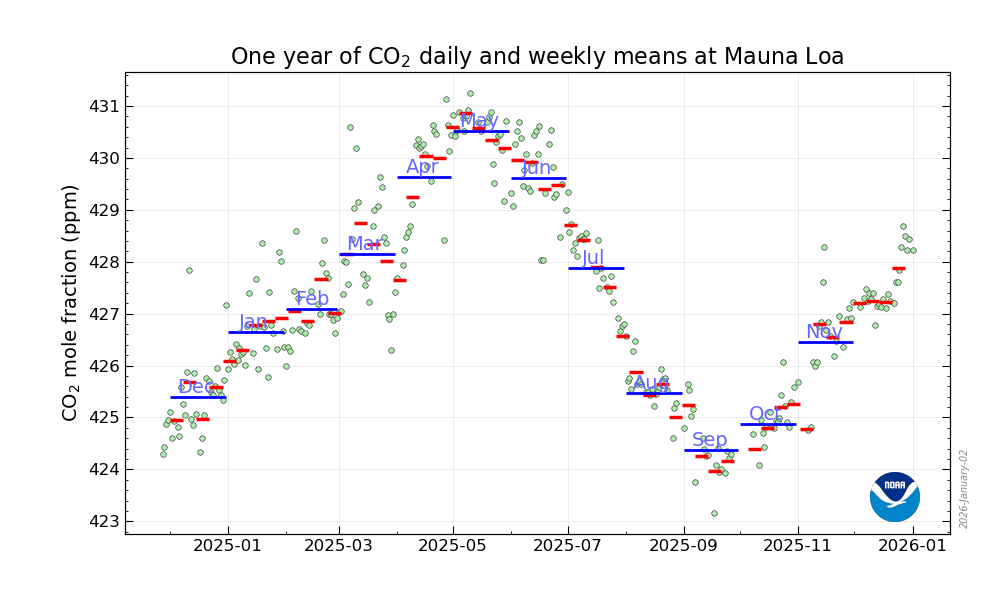
@Sustainable2050@mastodon.energyFinally, a more modest increase in atmospheric CO2 at Mauna Loa: based on daily values, the December average was 427.5 ppm, that's 2.1 ppm more than last year
#emissions #co2 #climatechange…
 @Sustainable2050@mastodon.energy
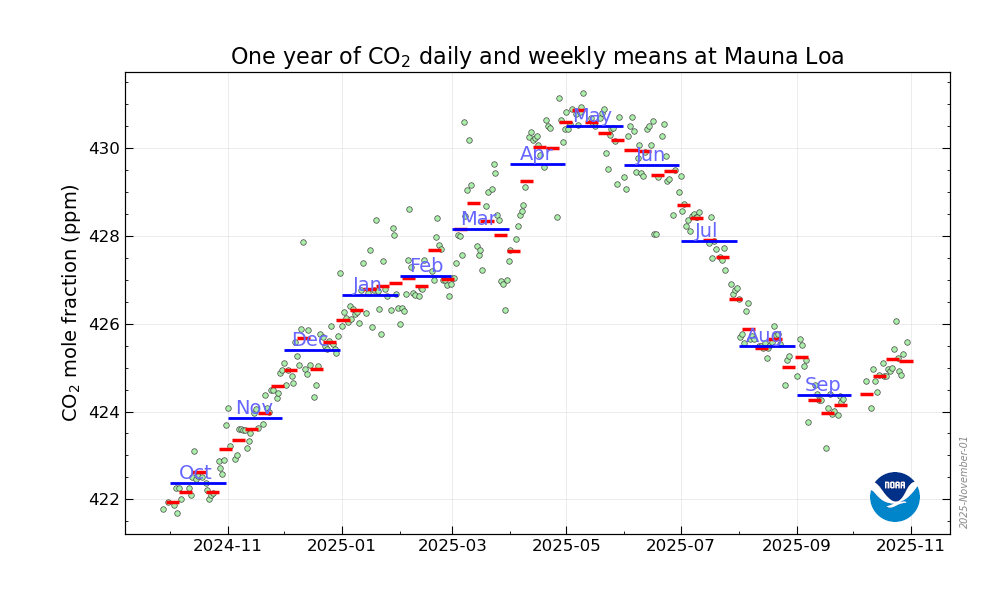
Another big jump in atmospheric CO2 at Mauna Loa: based on daily values, the October average was ~425.0 ppm, that's 2.6 ppm higher than last year.
"US government is closed; site not updated", so we'll have to rely on the automated data collection for now.
 @mxp@mastodon.acm.org
The nominal capacity of this seminar room is 25, I believe. The diagram shows the CO₂ levels with just 9 persons in the room. How is this considered acceptable?
 @Sustainable2050@mastodon.energy
Another big jump in atmospheric CO2, (still) measured at Mauna Loa: Based on daily values, the November average was ~426.5 ppm, that's around 2.7 ppm higher than last year!
#ClimateChange #CO2 #emissions
 @@arXiv_physicsatomph_bot@mastoxiv.page@mastoxiv.page
Demonstration of a Raman Velocity Filter in Collinear Laser Spectroscopy: Towards Applications for sub-ppm High-Voltage Measurements
Julien Spahn, Hendrik Bodnar, Kristian K\"onig, Wilfried N\"ortersh\"auser
https://arxiv.org/abs/2512.03921