 @frankel@mastodon.top
2026-05-26 09:25:49
@frankel@mastodon.top @datascience@genomic.social
Extract tables from pdfs with {tabulapdf} #rstats #datasciece
 @EarthOrgUK@mastodon.energy
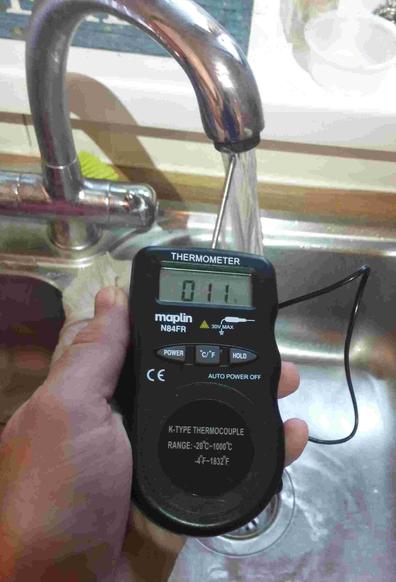
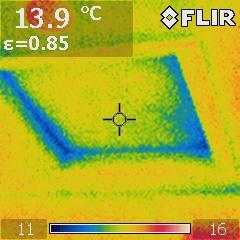
On 16WW Mains Inlet Water Temperature - Domestic mains water temperature data for 16WW on tap; seasonal min/max about 10C/20C in winter/summer. #dataset #water #temperature -
@datascience@genomic.social{nplyr} has helper functions to work on nested dataframes: #rstats #datascience
@EarthOrgUK@mastodon.energyOn 16WW Mains Inlet Water Temperature - Domestic mains water temperature data for 16WW on tap; seasonal min/max about 10C/20C in winter/summer. #dataset #water #temperature -
 @primonatura@mstdn.social
"Carbon storage could curb more than 90% of AI data center emissions, study finds"
#AI #ArtificialIntelligence #Technology
 @kubikpixel@chaos.social
«KI-Suche erklärt Trump für tot — Warum #DataPoisoning #FakeNews so gefährlich macht:
Künstliche Intelligenz soll das Auffinden von Informationen vereinfachen. Doch was passiert, wenn die Datenbasis gezielt mit absurden Details manipuliert wird, um Verwirrung zu stiften? Ein aktueller Vorfall …
@datascience@genomic.social @radioeinsmusicbot@mastodonapp.uk
🇺🇦 Auf radioeins läuft...
Data MC:
🎵 Fever
#NowPlaying #DataMC
Alle auf #radioeins gespielten Titel als #Spotify Playliste: https://open.spotify.com/playlist/3hdH98B6uyXilhcWxCA6nv
 @v_i_o_l_a@openbiblio.social
"Kontext und Klarheit: Fachspezifische #Metadaten für offene Bildungsressourcen (#OER) zu #DataLiteracy"
@EarthOrgUK@mastodon.energyOn 16WW Mains Inlet Water Temperature - Domestic mains water temperature data for 16WW on tap; seasonal min/max about 10C/20C in winter/summer. #dataset #water #temperature -
 @geant@mstdn.social
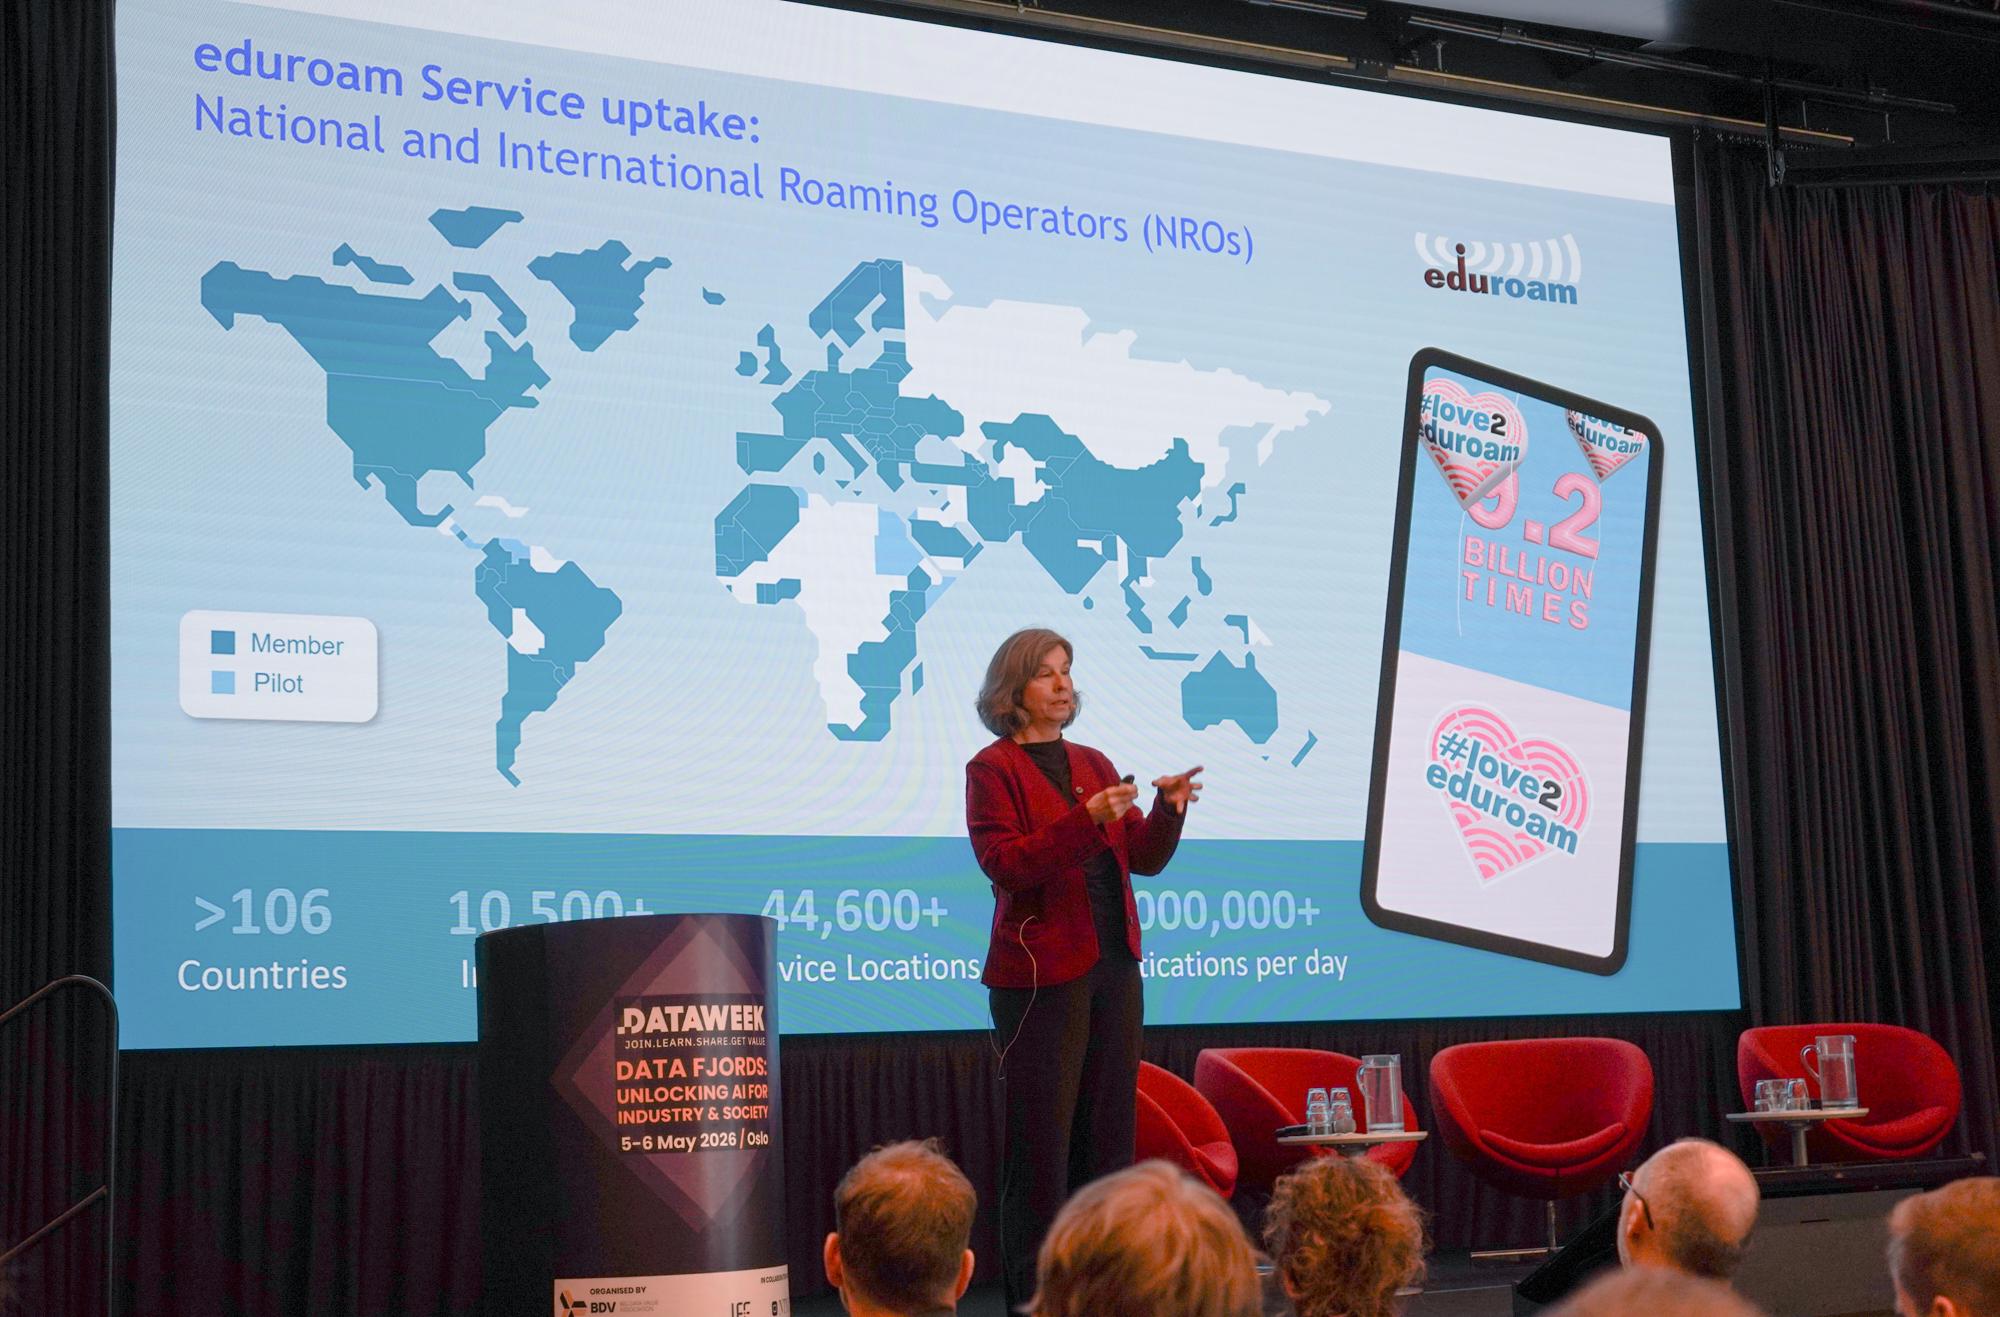
This month, we were in Oslo for #DataWeek26, where our Chief Communication Officer Cathrin Stöver delivered a keynote on GÉANT's value for the European data community.
A few highlights:
🔹 The role of GÉANT & NRENs in enabling high-performance computing across borders, specifically through our work with the EuroHPC JU
🔹 How our pan-European network is adapting its author…
 @burningbecks@social.tchncs.de
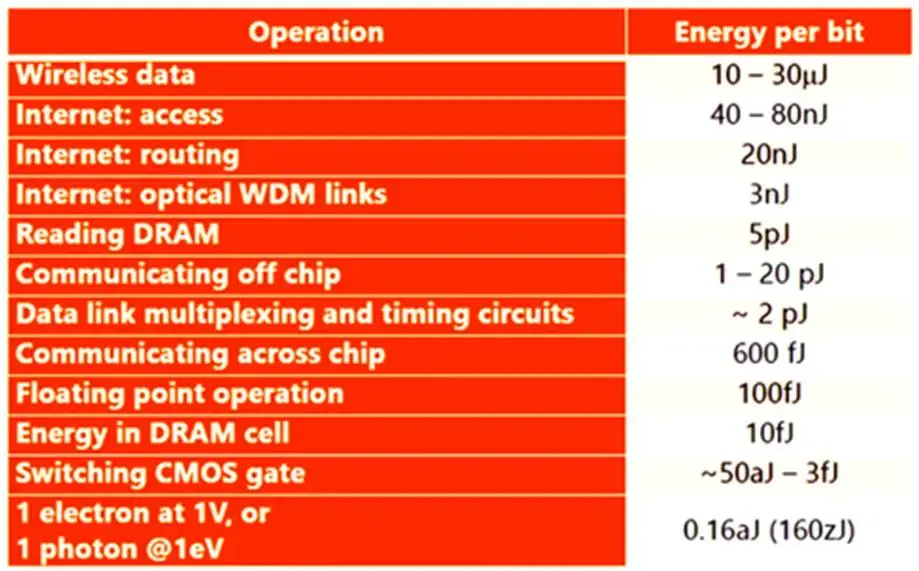
#Energy usage of operations on #Data.
Source: https://www.edn.com/taming-the-beast-memor
 @datascience@genomic.social
 @crell@phpc.social
One sign of maturity is that when a long-held belief is contradicted by verifiable new data, you change the belief, not the data.
Maybe not immediately, but in a reasonable amount of time.
#DataOverDogma
@EarthOrgUK@mastodon.energyOn 16WW Mains Inlet Water Temperature - Domestic mains water temperature data for 16WW on tap; seasonal min/max about 10C/20C in winter/summer. #dataset #water #temperature -
 @pixelpusher220@dmv.community
 @stefanlaser@social.tchncs.de
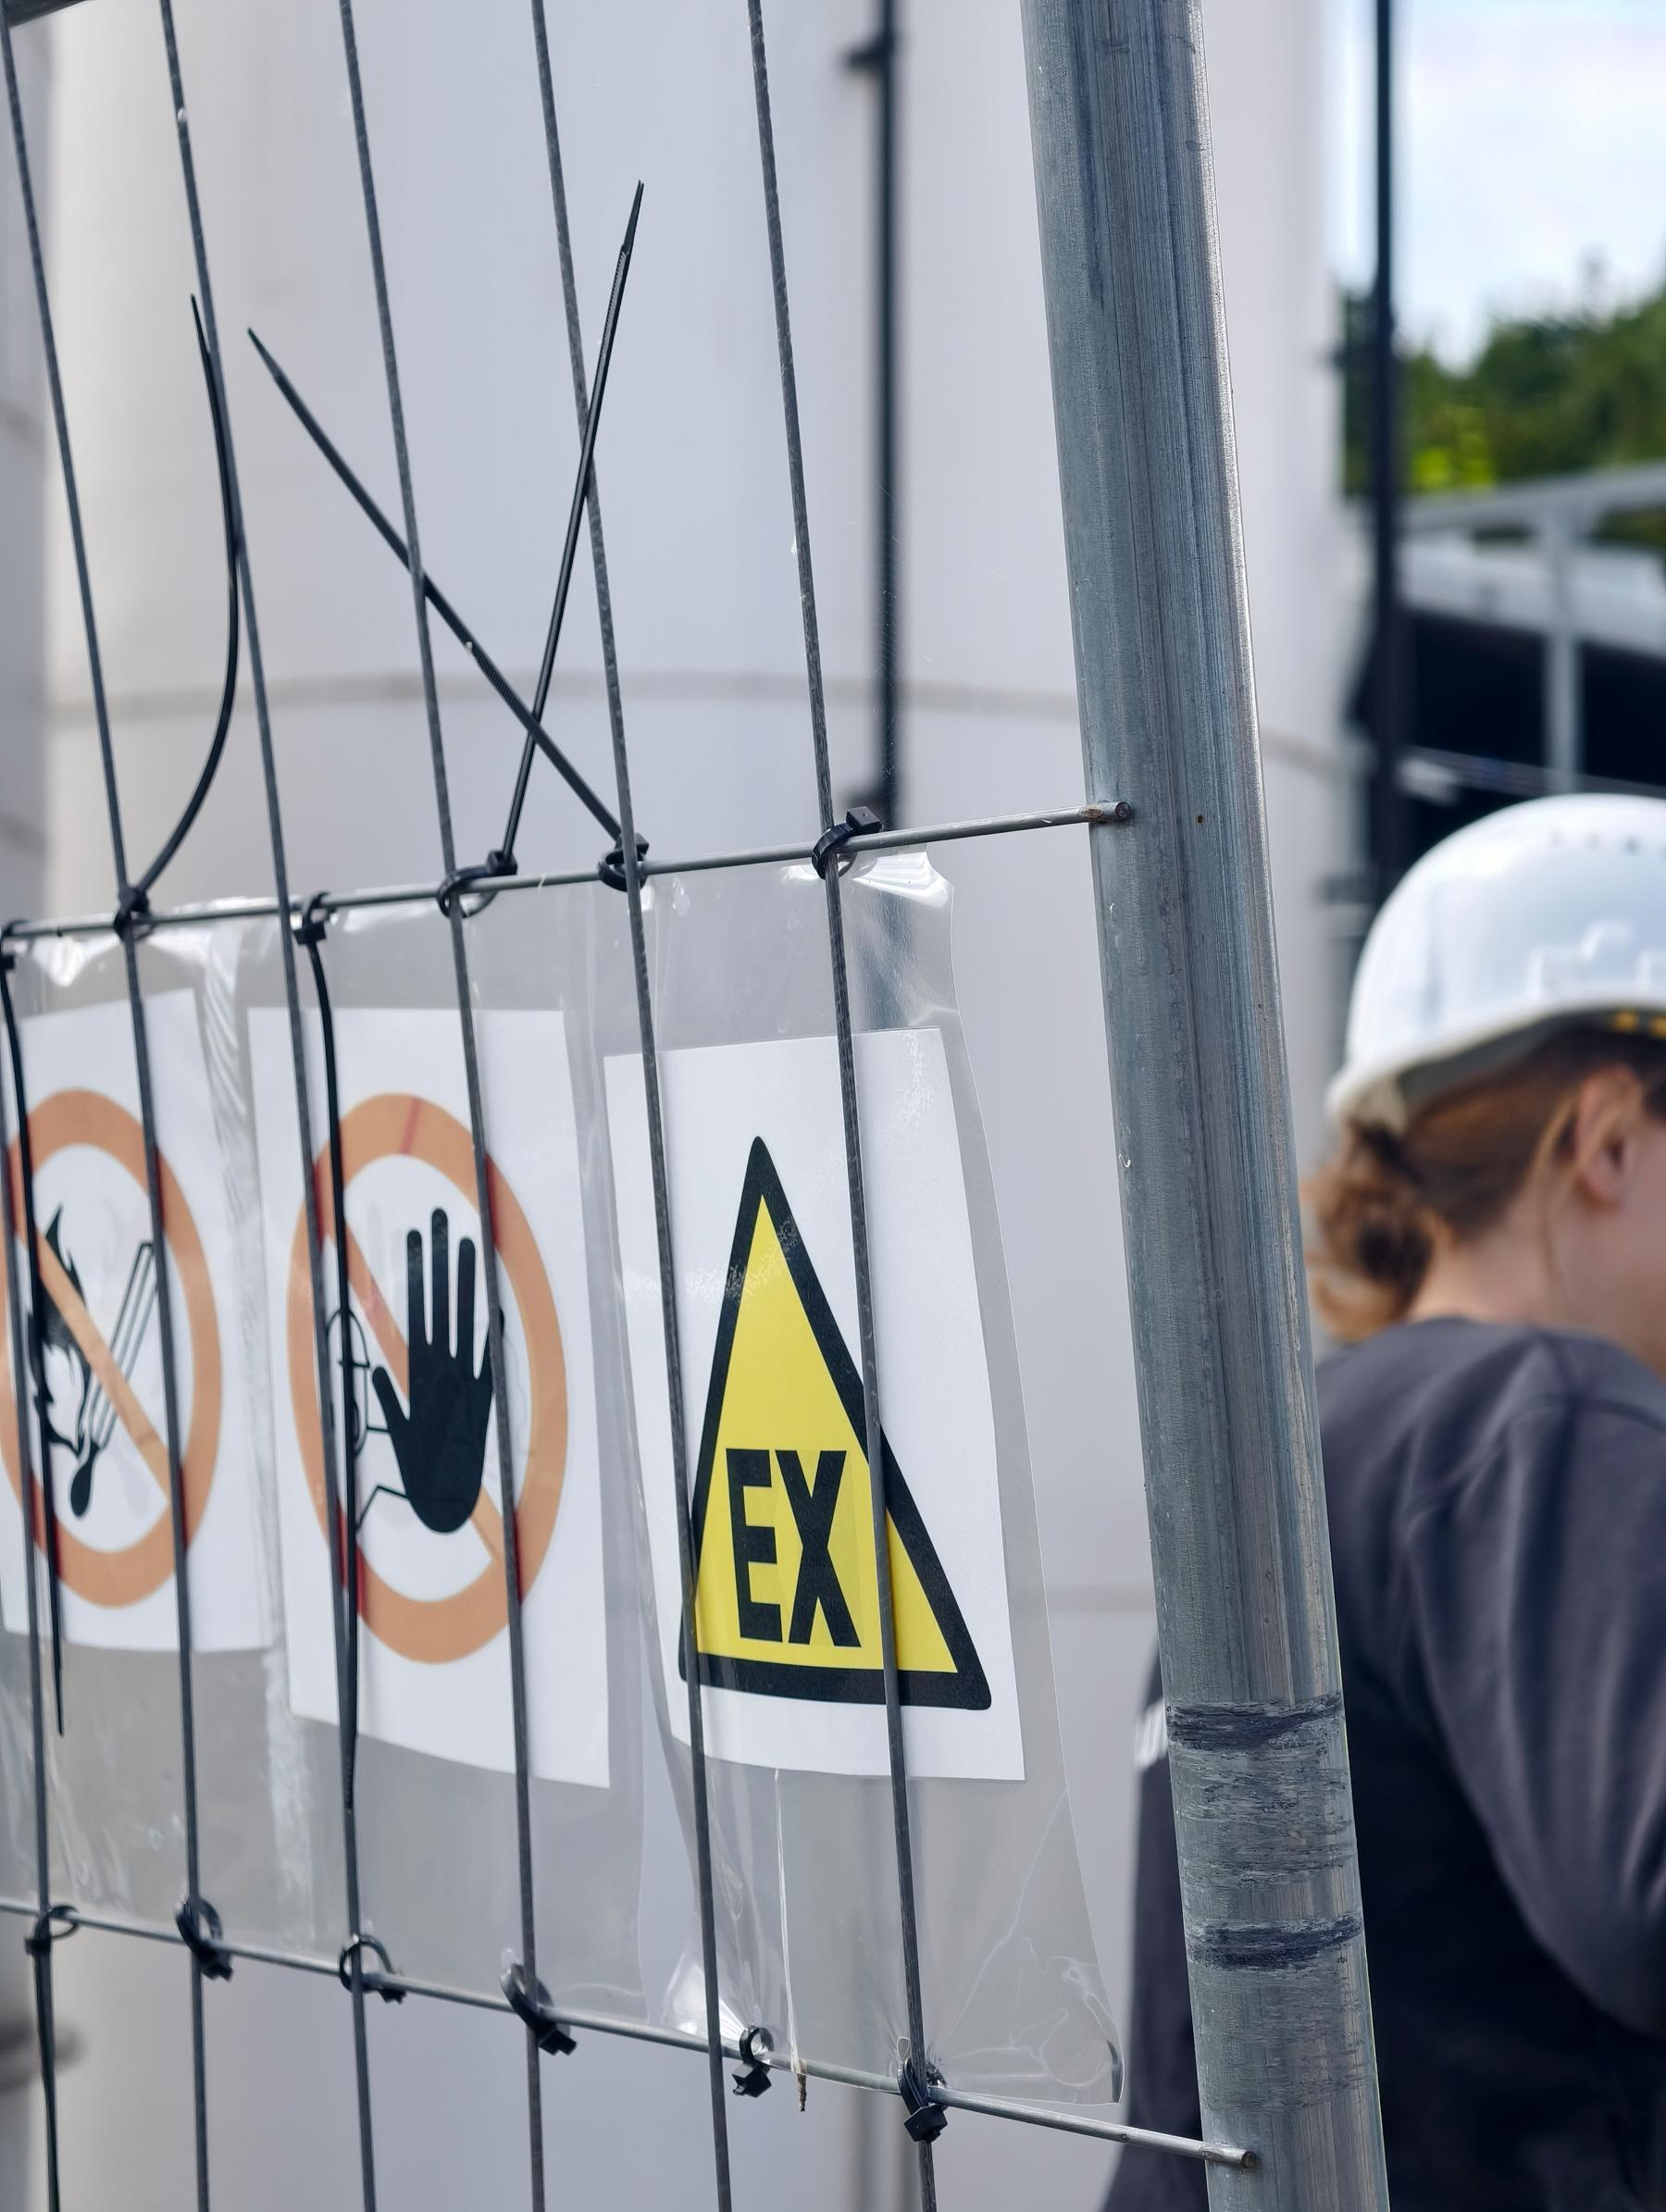
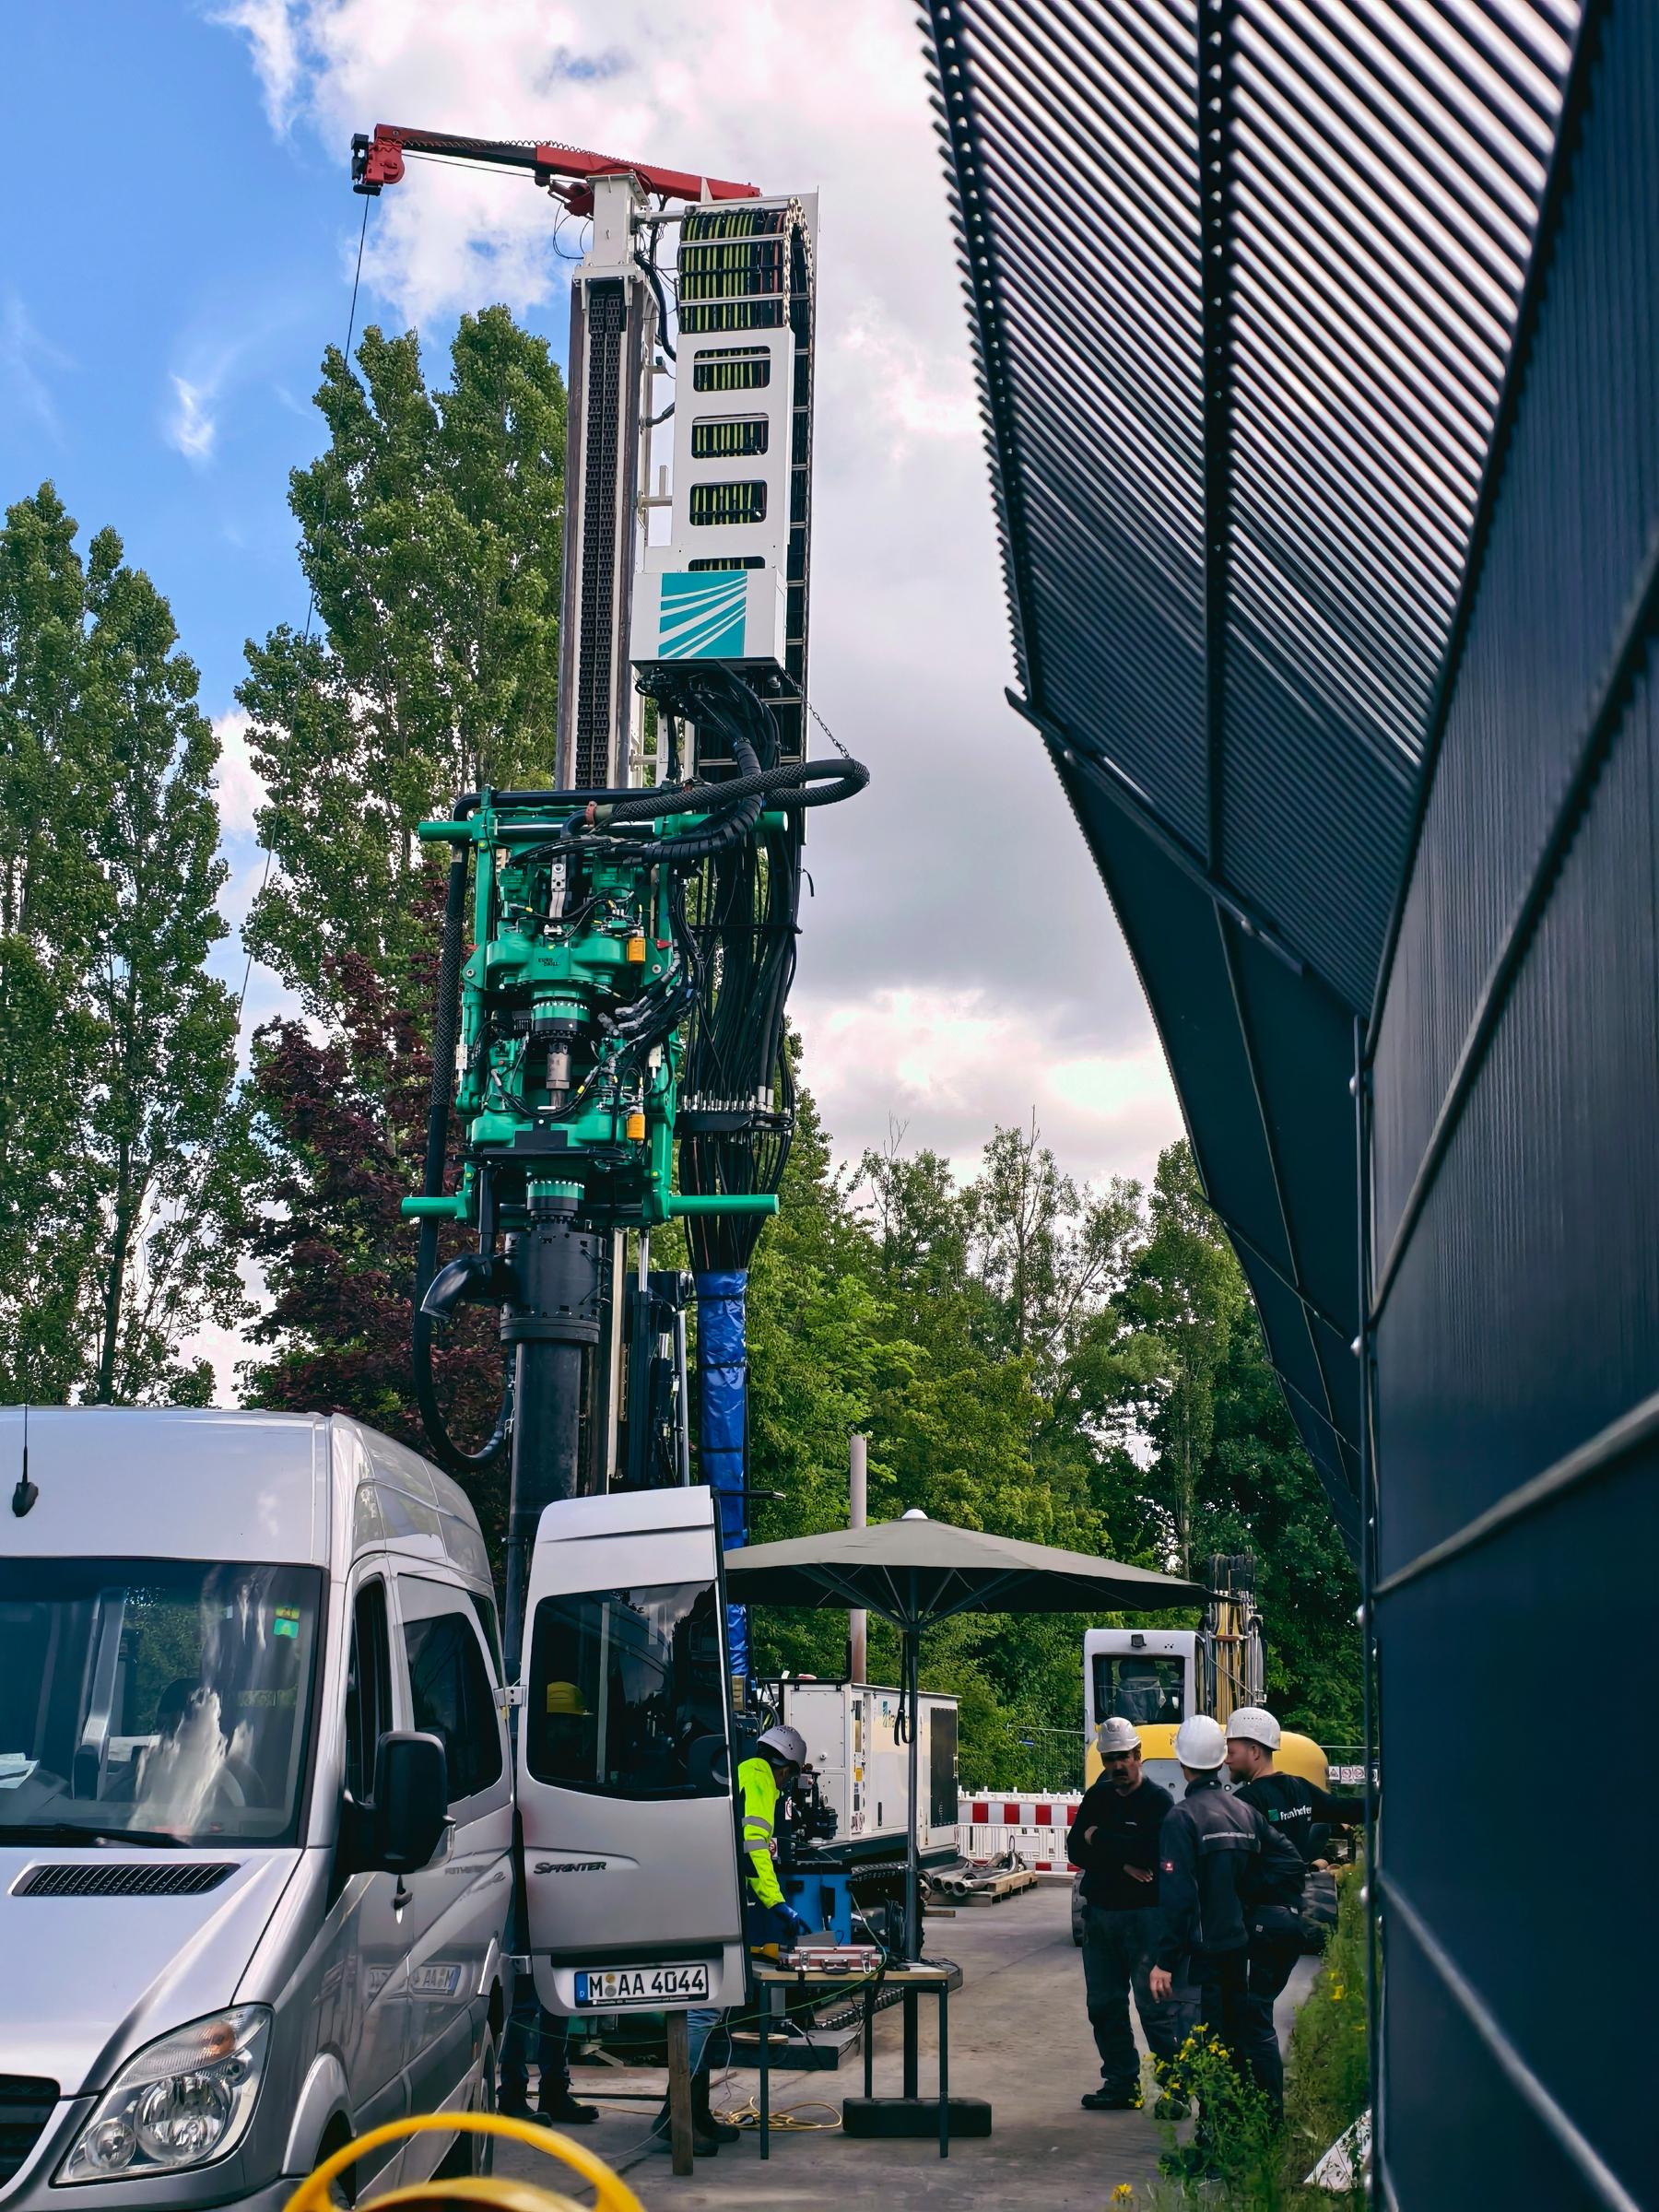
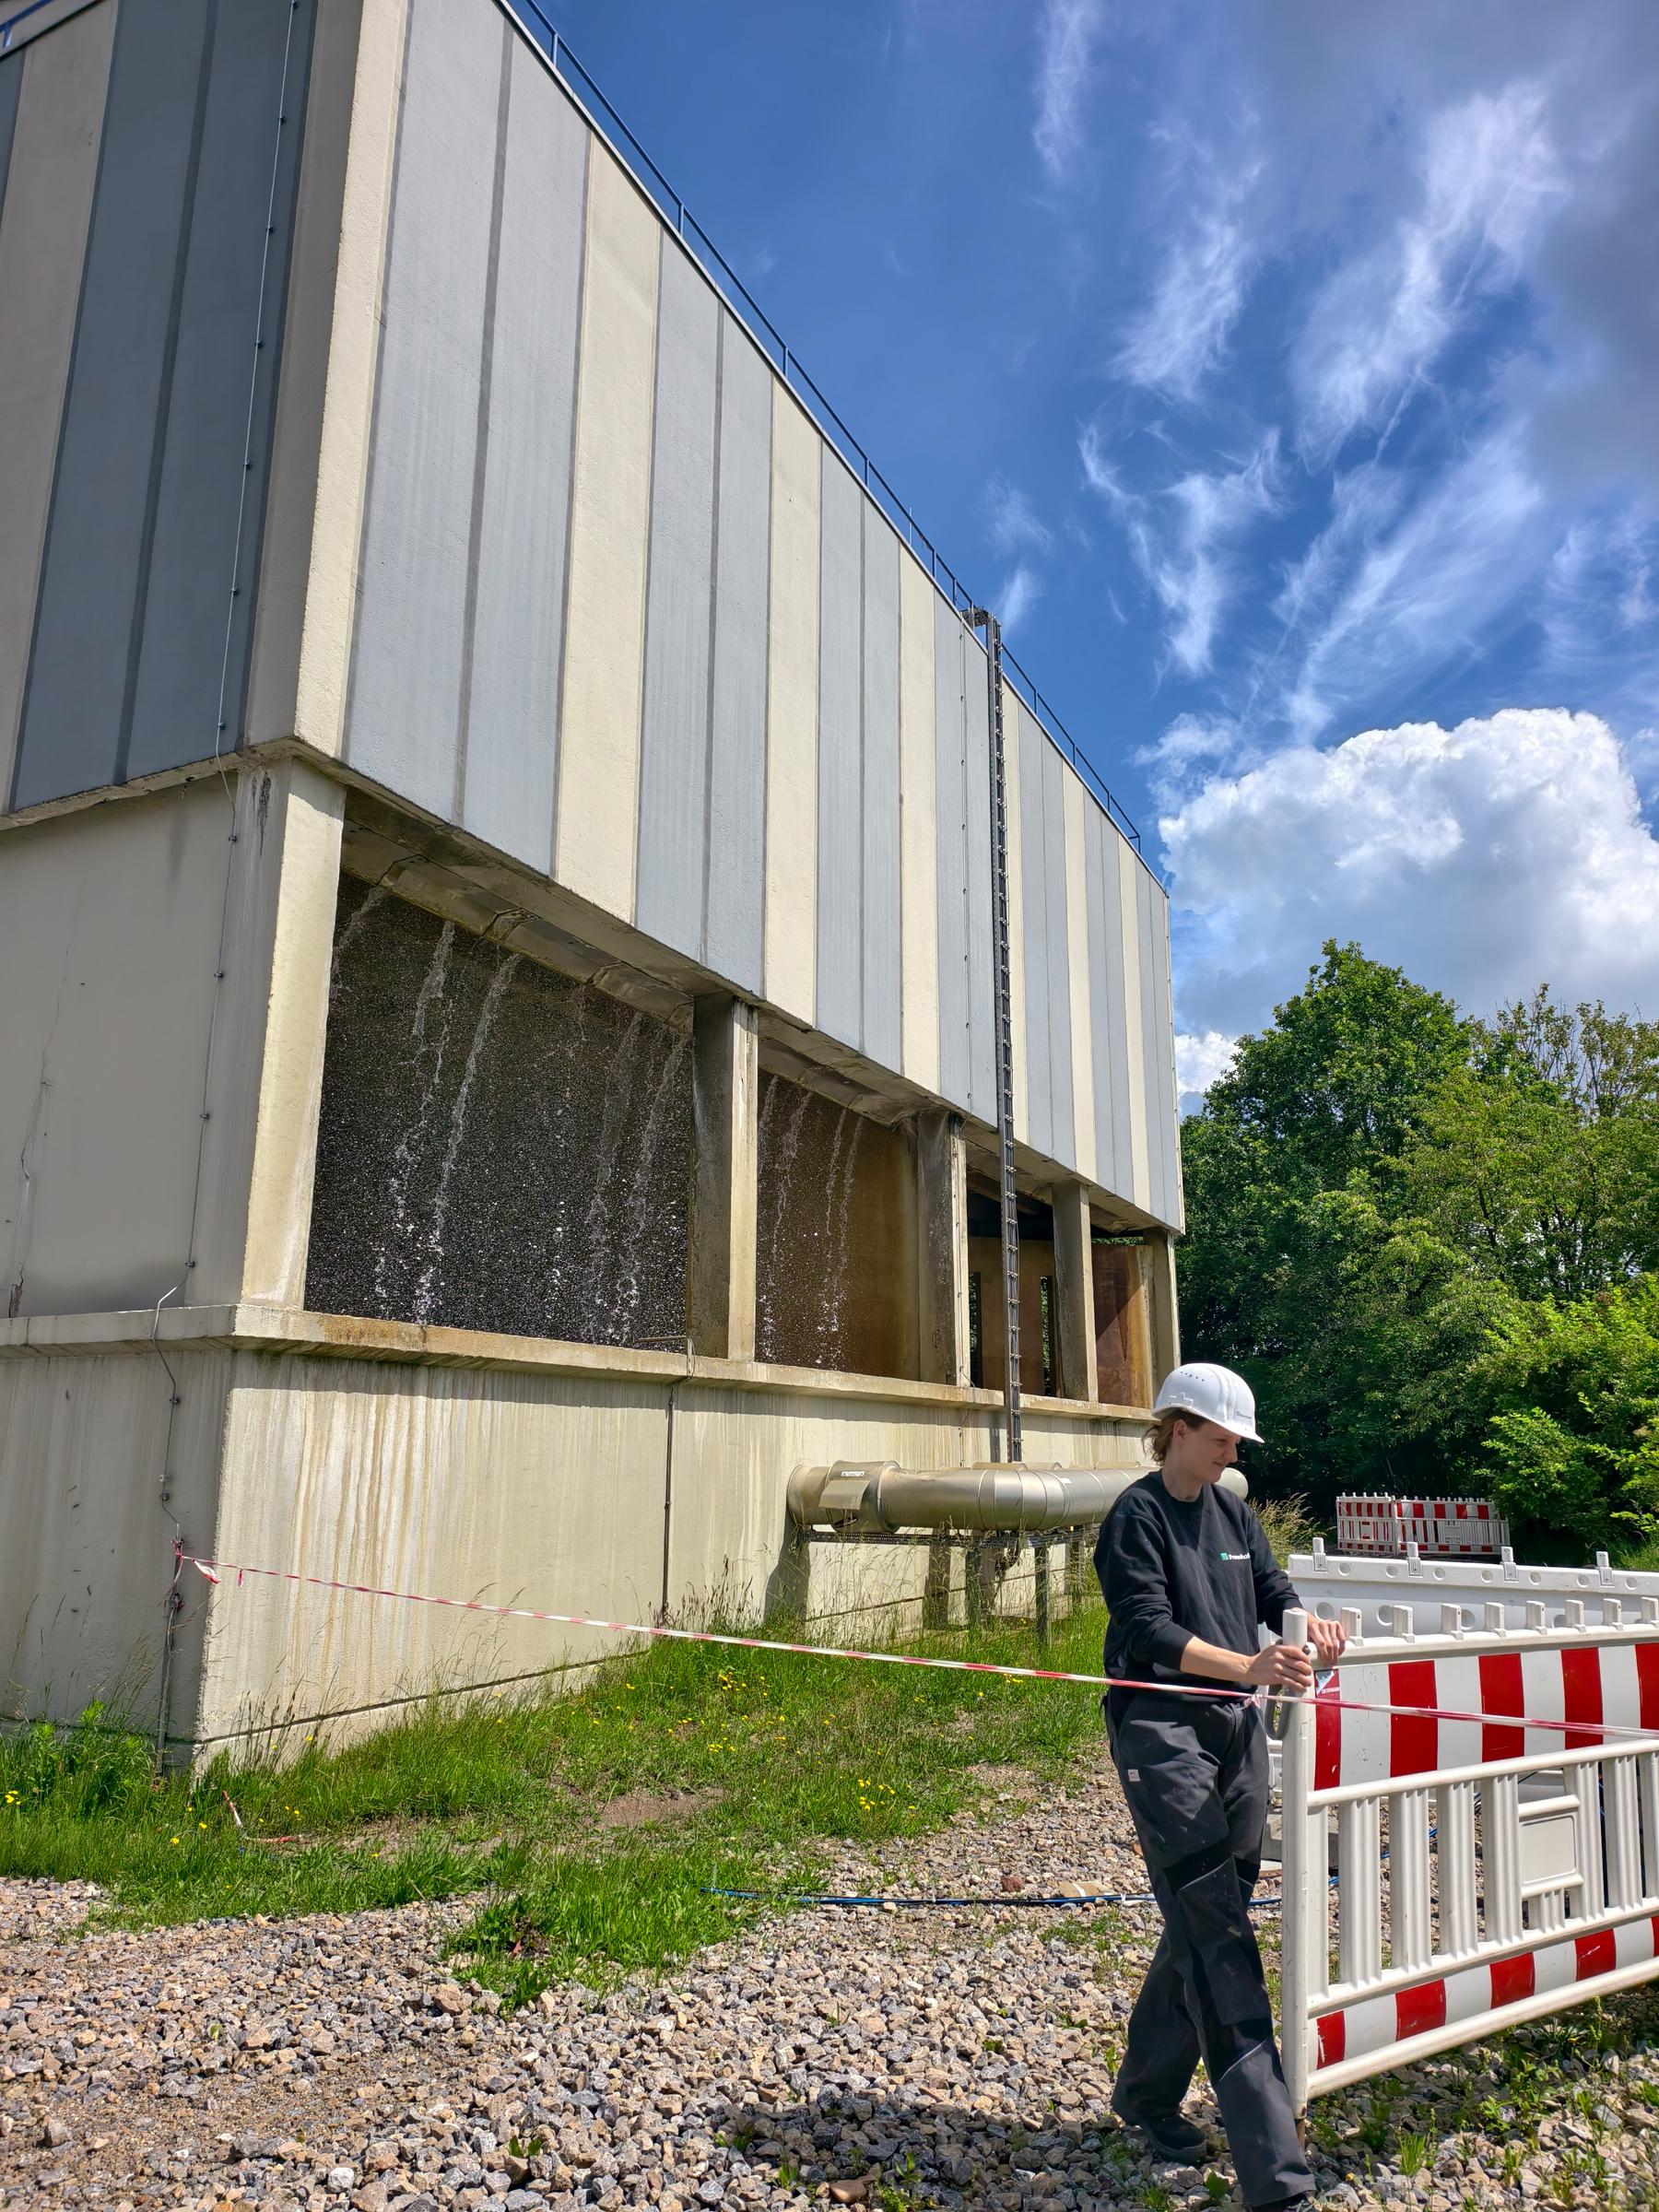
It’s waste week. As part of the campus mining walk I did during our DFG waste network meeting, we had a super lucky surprise meetup with a Fraunhofer project: next to the uni #datacenter, they are drilling into an abandoned mine to store heat from the nearby technical center (and data center), and the exploration was happening while we were they. We got a tour!!!
Our Ruhr University ca…
 @datascience@genomic.social
The {esquisse} package makes it easy to plot your data in different ways with a drag and drop interface: #rstats
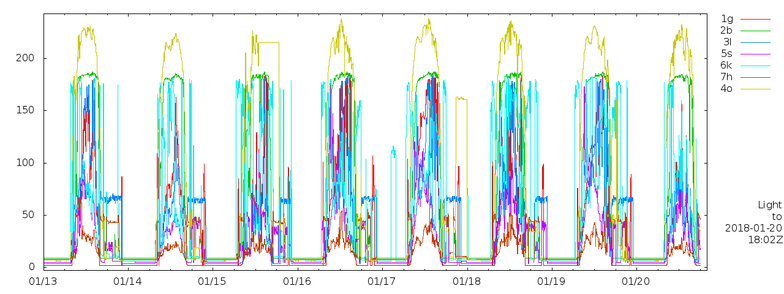
@EarthOrgUK@mastodon.energyOn 16WW Data Collections and Graphs - Open for research home #dataset - https://www.earth.org.uk/note-on-data.html
 @paulusm@scholar.social @EarthOrgUK@mastodon.energy
On 16WW Data Collections and Graphs - Open for research home #dataset - https://www.earth.org.uk/note-on-data.html
 @dhuyvetter@mastodon.social
US Law Enforcement Warns of #AntiTechExtremism as AI Hatred Grows
As Americans stew over the looming risk of job-stealing #AI and #dataCenters in their back yards, the feds are raising the…
 @joe@toot.works
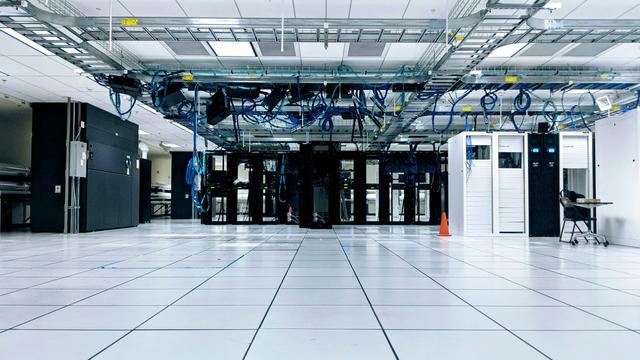
Oracle can afford the $15 billion data center but not the electricity needed to run it?
“The restrictions, part of a new electric rate structure approved by the commission in April, require that data center companies with credit ratings below A- post financial guarantees in the form of cash or lines of credit.”
#Oracle #PortWashington #DataCenter
@EarthOrgUK@mastodon.energyOn 16WW Data Collections and Graphs - Open for research home #dataset - https://www.earth.org.uk/note-on-data.html
@datascience@genomic.socialLets be honest, we spend too much time cleaning data. {janitor} can help with that: #rstats #datasciece
@EarthOrgUK@mastodon.energyOn 16WW Mains Inlet Water Temperature - Domestic mains water temperature data for 16WW on tap; seasonal min/max about 10C/20C in winter/summer. #dataset #water #temperature -
@EarthOrgUK@mastodon.energyOn 16WW Mains Inlet Water Temperature - Domestic mains water temperature data for 16WW on tap; seasonal min/max about 10C/20C in winter/summer. #dataset #water #temperature -
@EarthOrgUK@mastodon.energyOn 16WW Mains Inlet Water Temperature - Domestic mains water temperature data for 16WW on tap; seasonal min/max about 10C/20C in winter/summer. #dataset #water #temperature -
@frankel@mastodon.top#GEDCOM, the #Genealogy #Data #Standard
 @kingconsult@berlin.social
Research Paper: »Off-Platform #Tracking and Data Externalities: Evidence from #Facebook«
> Digital platforms increasingly observe individuals' browsing behavior beyond the boundaries of their own services.
Luis Aguiar, University of Zurich
Christian Peukert, University of Lausanne
Max Schäfer, University of Bologna
Hannes Ullrich, #DIW Berlin
June 05, 2026:
👉 #SocialMedia #Meta #DataProtection #GDPR #Datenschutz #TeamDatenschutz #privacy