 @Nathan@social.lostinok.com
2026-04-20 02:04:15
For anyone in central Oklahoma in search of some family entertainment, I highly suggest the Vernardos circus in North OKC. They are here for one more week. A really great special circus experience for one and all.


 @metacurity@infosec.exchange
2026-03-20 11:47:24

 @v_i_o_l_a@openbiblio.social
2026-02-20 12:39:55
in der "IQ – Wissenschaft und Forschung"-#podcast-folge "Warum leuchten Tiere? Neue Indizien" werden ganz kurz pink leuchtende flughörnchen erwähnt. ich finde, die wären eine eigene folge wert! 🙃
 @netzschleuder@social.skewed.de
2026-03-20 16:00:06
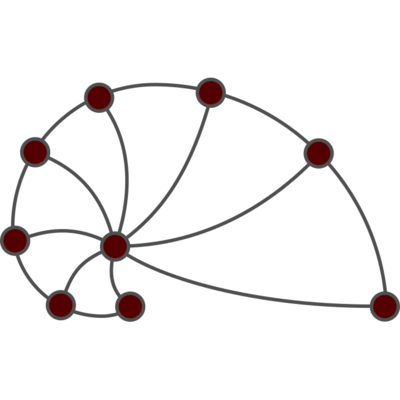
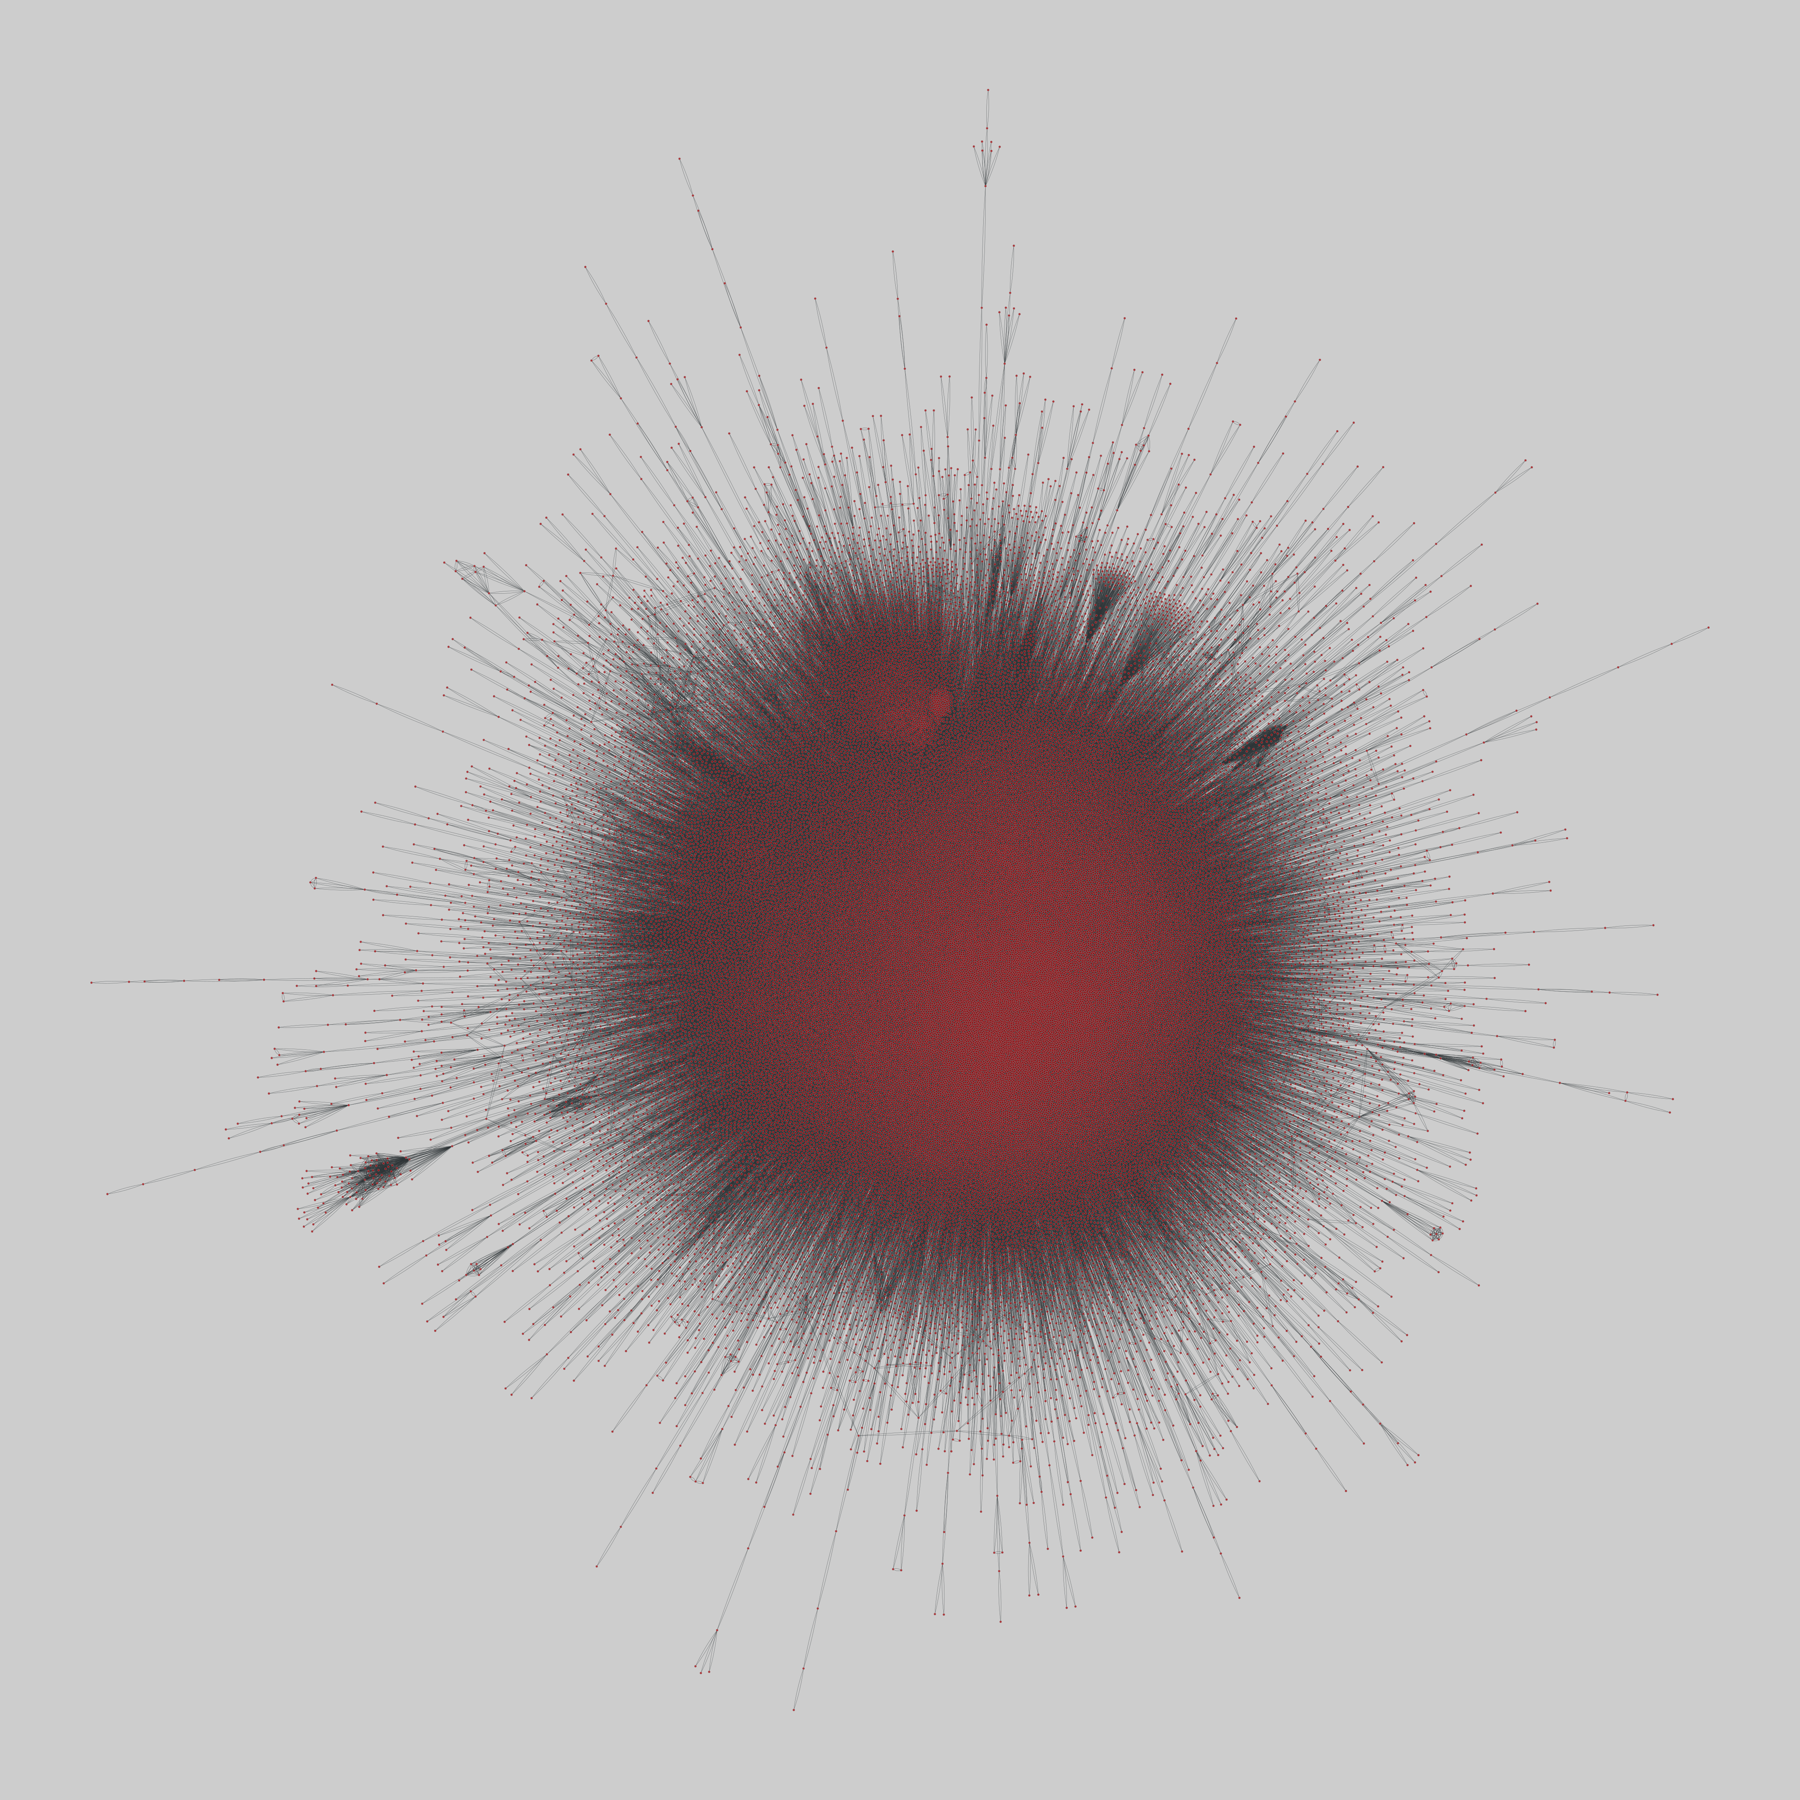
social_location: Location-based social networks
Two location-based online social networks, where nodes are accounts and edges are declared friendships. Networks includes checkins by these users.
This network has 58228 nodes and 428156 edges.
Tags: Social, Online, Spatial
https://networks.skewed…
 @tinoeberl@mastodon.online
2026-04-20 06:08:02
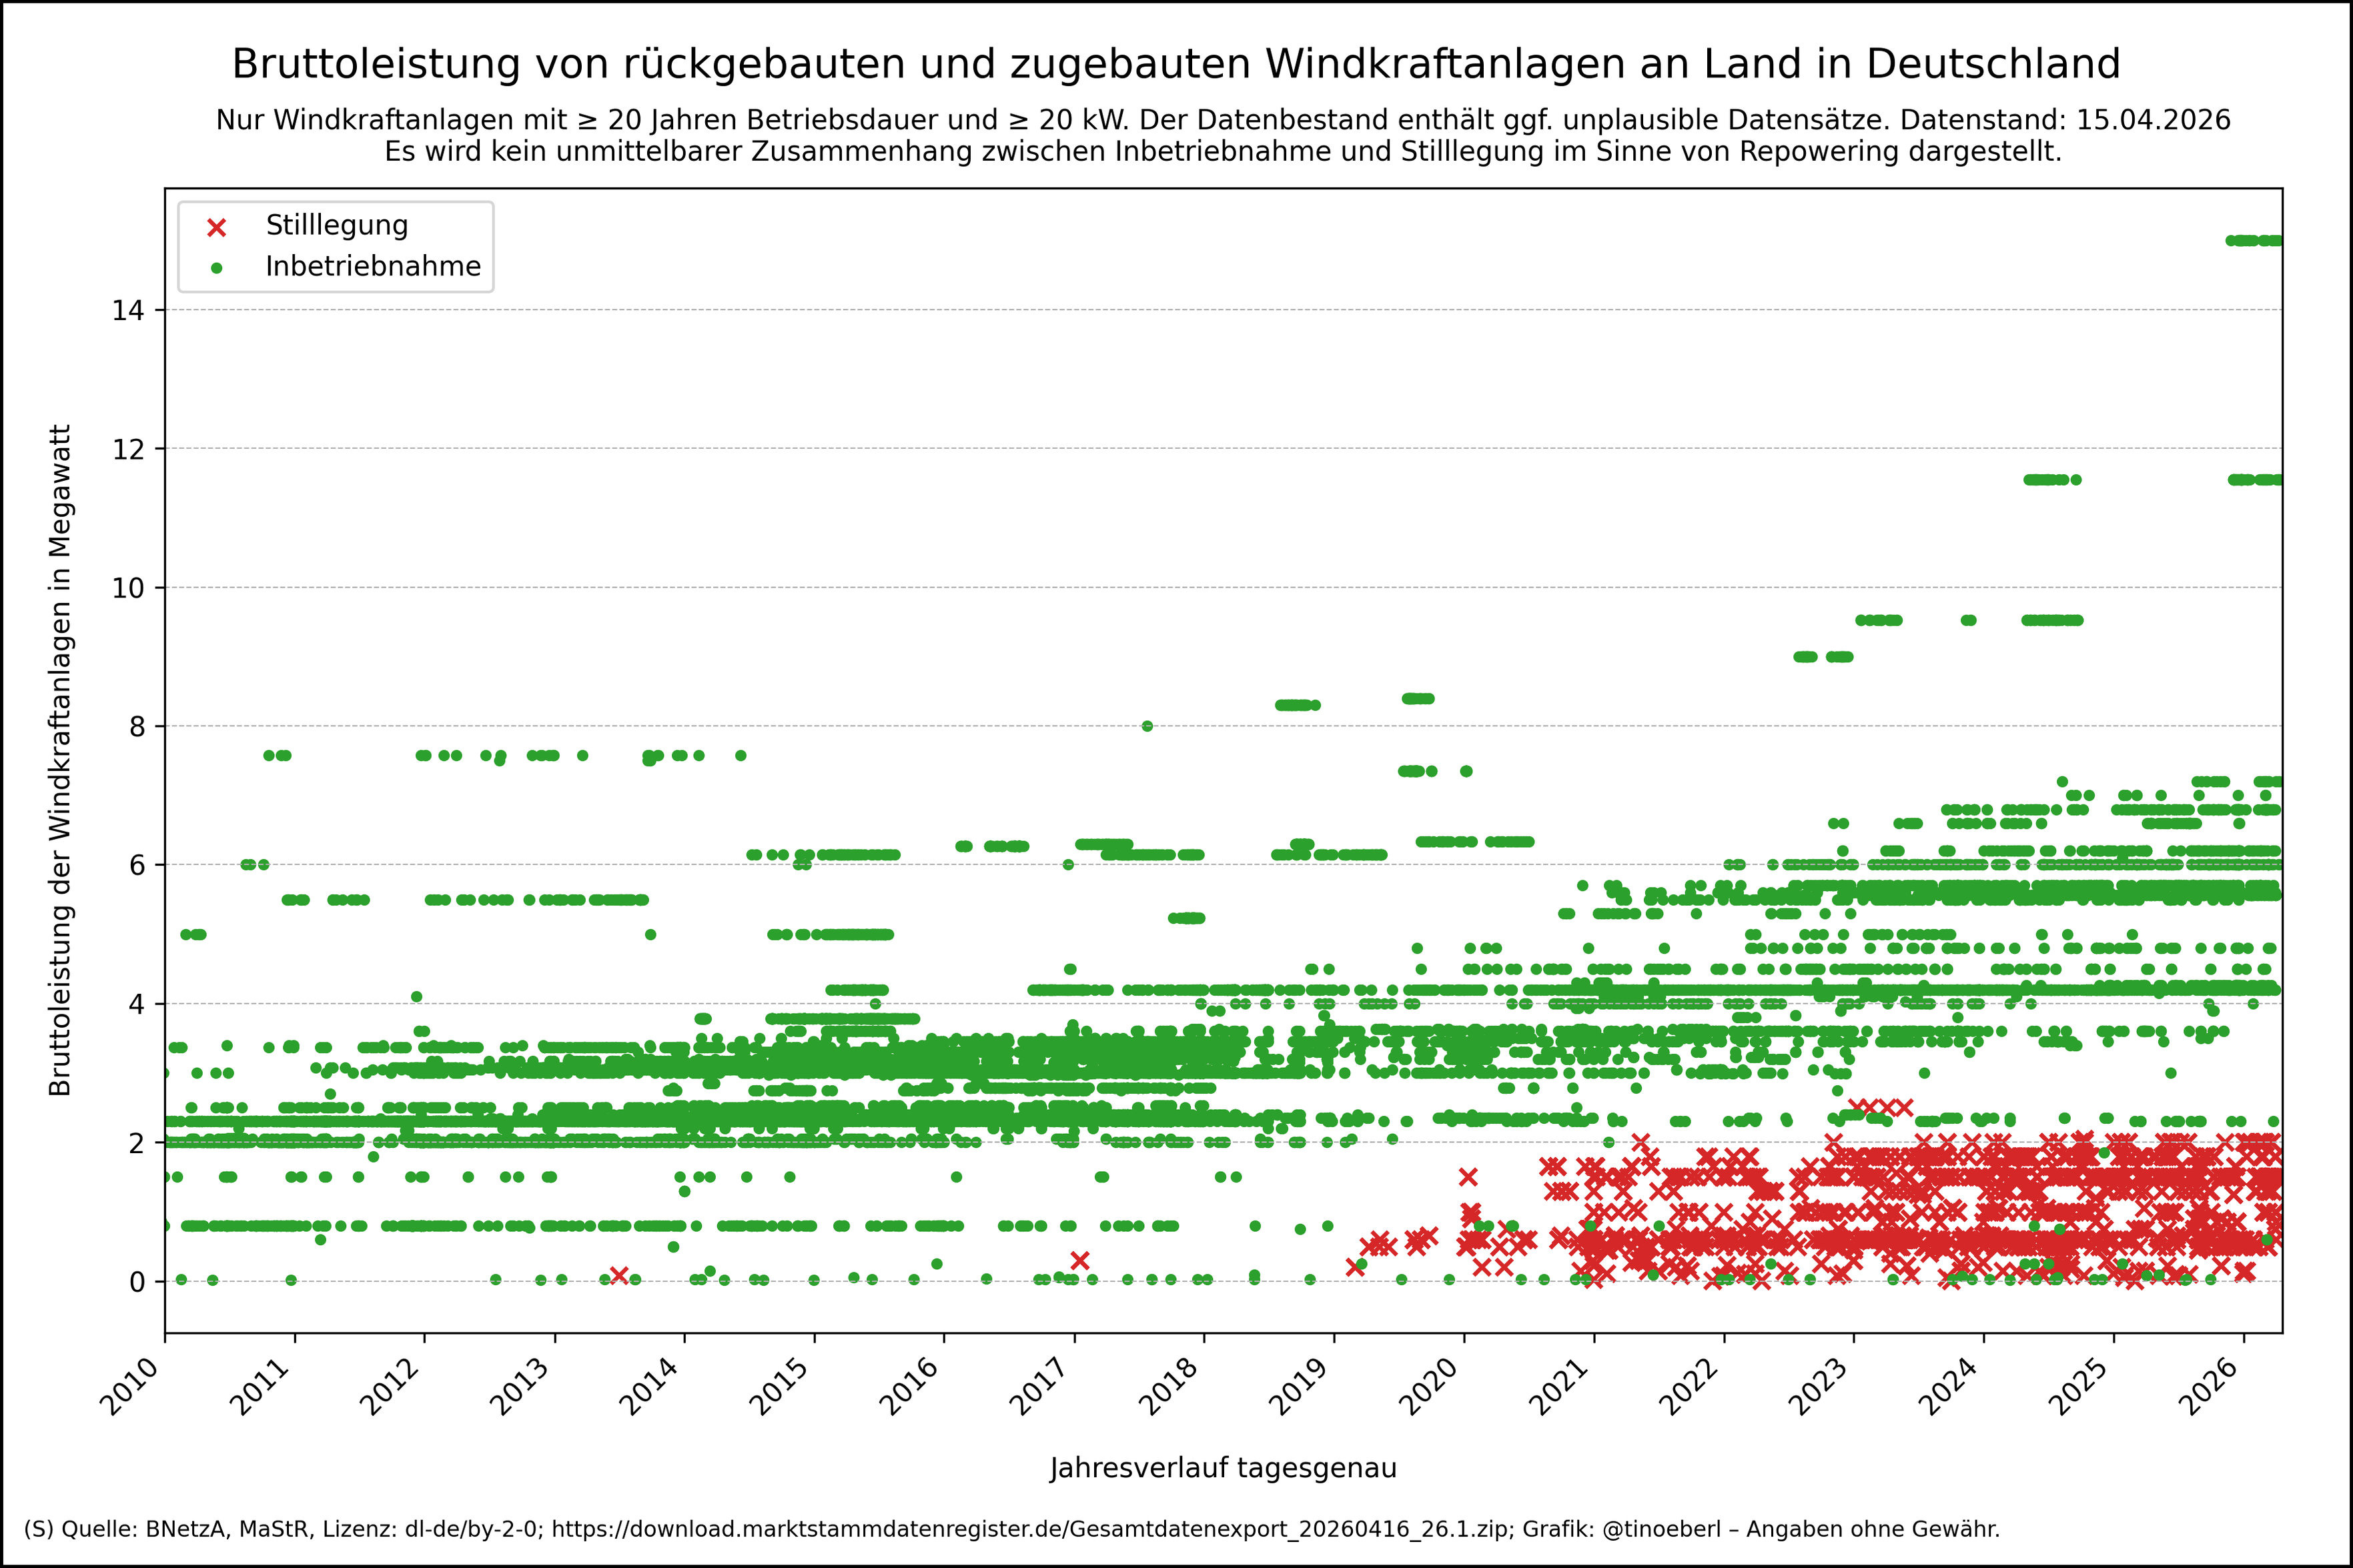
Bruttoleistung von rückgebauten und zugebauten #Windkraftanlagen an Land in #Deutschland mit Stand vom 15.04.2026.
Illustriert wird der Rückbau von kleinen Anlagen mit üblicherweise > 20 Betriebsjahren im Vergleich zu leistungsstärkeren neuen Anlagen. Keine 1:1 Beziehung hinsic…
 @benb@osintua.eu
2026-01-21 01:18:15
Last-minute Patriot and NASAMS deliveries help Ukraine repel mass Russian strike, Zelensky says: https://benborges.xyz/2026/01/21/lastminute-patriot-and-nasams-deliveries.html
 @servelan@newsie.social
2026-04-20 00:33:29
Pancreatic cancer mRNA vaccine shows lasting results in an early trial
https://www.nbcnews.com/health/cancer/pancreatic-cancer-mrna-vaccine-shows-lasting-results-early-trial-rcna331969
 @hnnng@chaos.social
2026-03-20 17:11:22

 @heiseonline@social.heise.de
2026-04-21 09:01:00
@heiseonline@social.heise.de2026-04-21 10:19:00