@kcarruthers@mastodon.social
2024-04-25 20:38:27
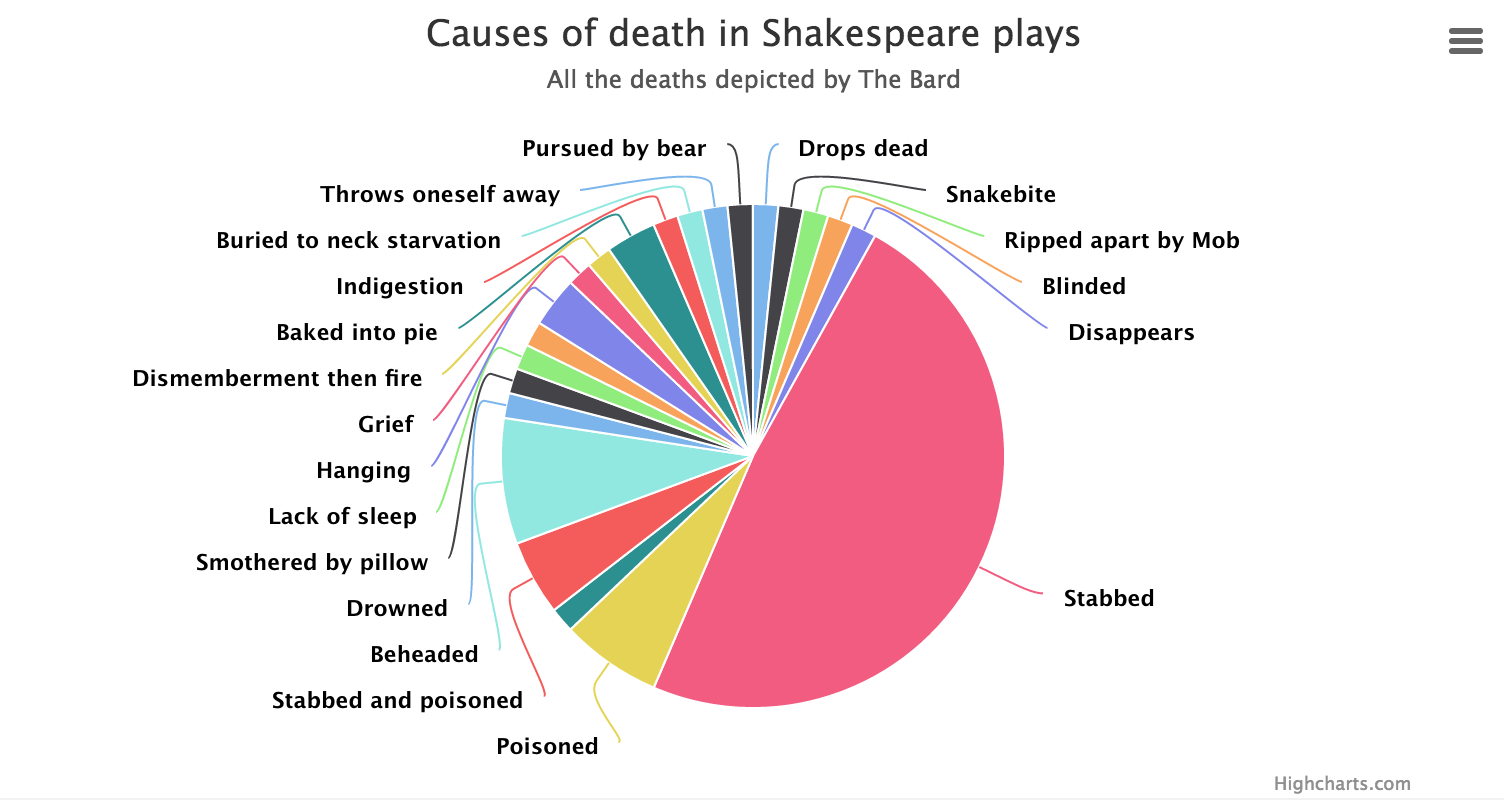
An oldie but a goodie: every death in Shakespeare, in one chart
https://www.vox.com/2016/1/3/10702004/shakespeare-death-chart

 @cdarwin@c.im
2024-04-26 21:07:03
It's not at all hard for a Shakespeare fan to be at least somewhat familiar with all 38 plays
— even the ones that, objectively speaking, are really not that great (ahem, Cymbeline).
And it's possible for an enterprising data journalist, like the ones at the Telegraph (UK), to compile every single death in a Shakespeare play into a single chart

 @cowboys@darktundra.xyz
2024-04-26 23:06:39

 @v_i_o_l_a@openbiblio.social
2024-05-26 08:46:28
"Things are going really badly upstairs. Can we use a bit of your wall?" – #TomGauld for New Scientist.
https://twitter.com/tomgauld/status/1794649500772176013
![Two people stand before a large chart on a wall. The red line zigzags across the chart, but the trend is downwards. In fact it goes off the bottom of the chart, across four additonal bits of graph paper until it literally hits the floor.
One of the poeple goes down to the office below and says to the worker within
"Things are going really badly upstairs. Can we use a bit of your wall?"
[alt text by tom gauld, https://twitter.com/tomgauld/status/1794649500772176013]](https://openbiblio.social/system/media_attachments/files/112/506/511/203/644/506/original/c224f820217864bf.jpeg)
 @arXiv_csCV_bot@mastoxiv.page
2024-04-26 08:32:28
This https://arxiv.org/abs/2404.09987 has been replaced.
initial toot: https://mastoxiv.page/@arXiv_csCV_…

 @althavin@mastodon.social
2024-05-26 07:34:34
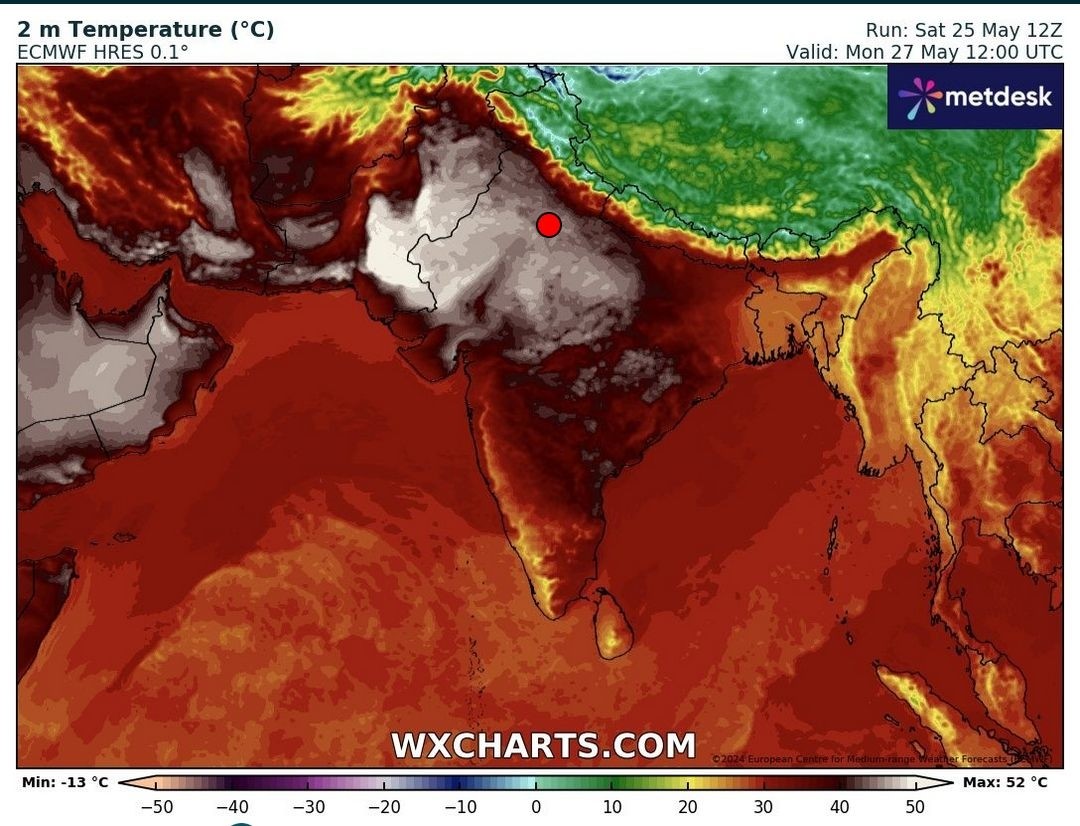
Was für eine Katastrophe!
Mich lässt das fassungslos und bestürzt zurück. Quasi der ganze Norden Indiens 50°C. Das ist Todeszone für effektiv alles Leben.
https:/…
 @isonno@mastodon.social
2024-05-26 22:28:08
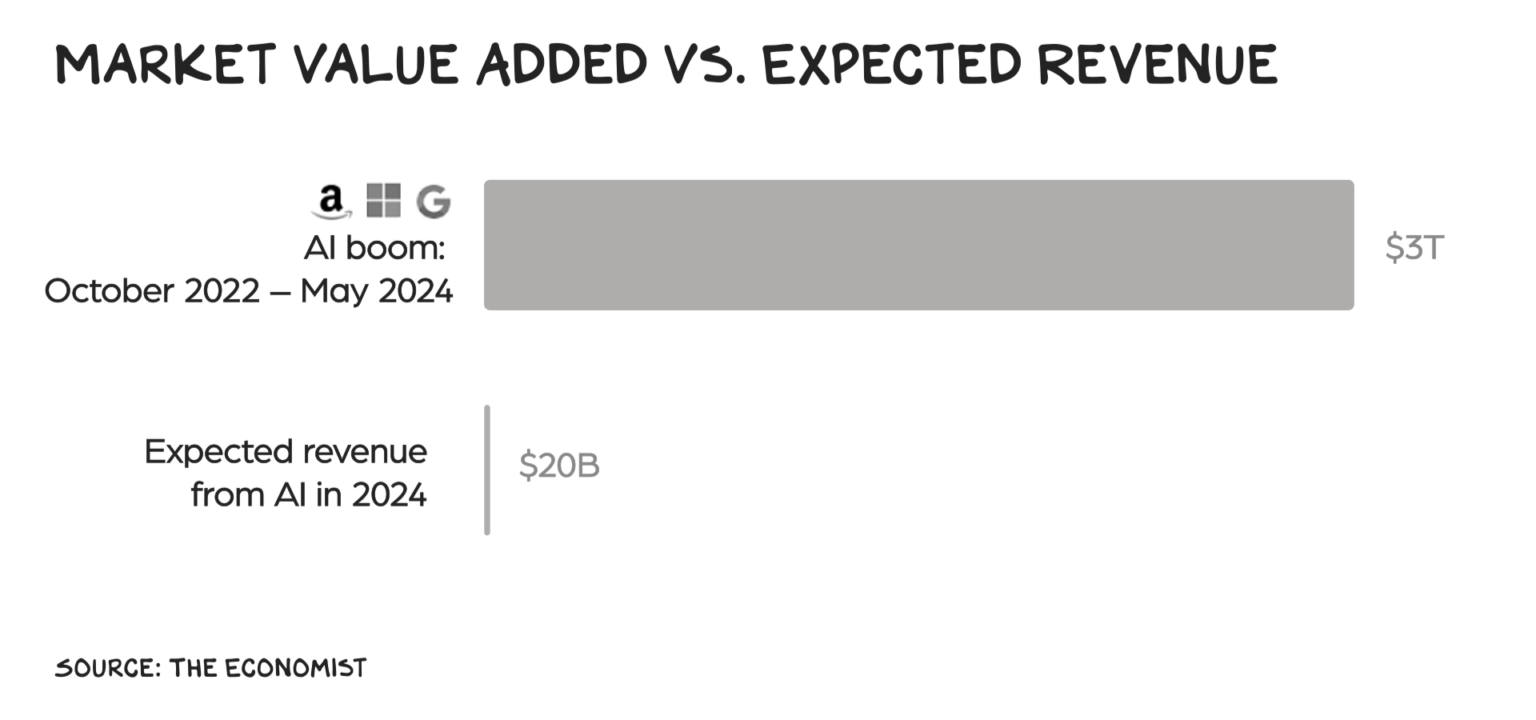
From Prof Galloway: The AI bubble in a single chart:
 @toxi@mastodon.thi.ng
2024-05-25 11:09:58
Example #164: Piechart SVG generation/visualization of CSV data using https://thi.ng/geom & https://thi.ng/csv
(Like th…


 @Mediagazer@mstdn.social
2024-04-25 22:30:32
Sources: Paramount and Skydance move closer to a deal, but Paramount's renewal agreement with Charter, which has an April 30 deadline, is a significant hurdle (Alex Sherman/CNBC)
https://www.cnbc.com/2024/04/25/paramount-skydance-inch-…
@kcarruthers@mastodon.social2024-05-26 01:50:26
Concrete & steel production are major sources of CO2 emissions, but a new solution from Cambridge University could recycle both at the same time. This new process purifies iron & produces “reactivated cement” as a byproduct. If done using renewable energy, the process could make carbon-zero cement
https://www.