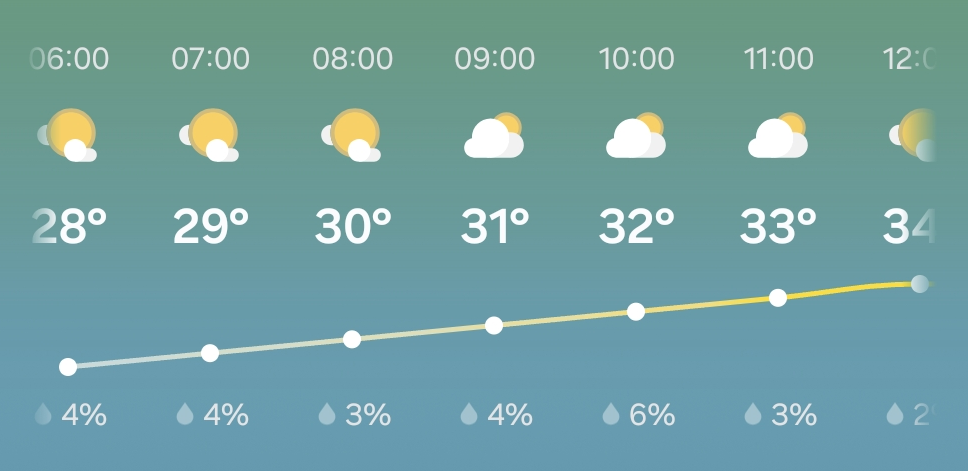
It’s satisfying to see a nice linear chart showing a constant 1°C temperature increase per hour. But also, 🥵.#weather #charts
 @seav@en.osm.town