 @datascience@genomic.social
2026-06-14 10:00:01
What They Forgot to Teach You About R: #rstats
@datascience@genomic.socialWhat They Forgot to Teach You About R: #rstats
@datascience@genomic.socialGetting started with Shiny to make interactive web-apps with R: #rstats
@datascience@genomic.socialThe {esquisse} package makes it easy to plot your data in different ways with a drag and drop interface: #rstats
@datascience@genomic.socialKeynote from rstudio::conf 2022: The past and future of shiny. #rstats
 @EgorKotov@datasci.social @datascience@genomic.social
 @teoten@social.linux.pizza
 @paulusm@scholar.social
New blog post: Effective mental health techniques according to therapists and the public on Reddit – Dr Paul Matthews
#MentalHealth #RStats
@datascience@genomic.social @datascience@genomic.social @Carwil@mastodon.online @datascience@genomic.social
{slider} helps with aggregation over (sliding) windows, both index and time period based: #rstats
@datascience@genomic.socialIts good to have many tests in your R package, but it can be a pain to debug some failing tests when it happens. {lazytest} for the rescue: only rerun the failing tests, until they pass: #RStats
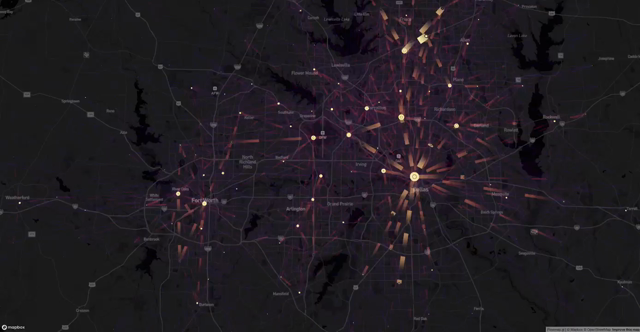
@EgorKotov@datasci.social#rstats mapgl is now on CRAN with flowmaps support! As previewed at #MobileTartu (Mobility Lab, University of Tartu) and Association of Geographic Information Laboratories in Europe (#AGILE) conferences! (Video by Kyle Walker). Backend is Flowmap.gl
 @datascience@genomic.social @datascience@genomic.social @datascience@genomic.social
Use multi level models with {parsnip}: http://multilevelmod.tidymodels.org/ #rstats #ML
@datascience@genomic.socialCute comics of R functions by @…: https://allisonhorst.com/r-packages-functions
@datascience@genomic.socialDo you (sometimes) use print() or message() for debugging your code? Next time you can use {icecream} instead: #rstats
@datascience@genomic.socialA curated list of awesome tools to assist 📦 development in R programming language. #rstats #📦
@datascience@genomic.socialThe inner working of parquette/arrow data in R: #rstats
@datascience@genomic.social @datascience@genomic.social{dtrack} makes documentation of data wrangling part of the analysis and creates pretty flow charts: #rstats
@datascience@genomic.socialThe functions in the {withr} package allow to change your environment temporarily. E.g. create a temp file for a {testthat} test and clean it up afterwards. #rstats
@datascience@genomic.socialI am more fluent in LaTeX than in plotmath expression. If you are the same, latex2exp will make your life easier. https://cran.r-project.org/web/packages/latex2exp/vignettes/using-latex2exp.html
 @sascha_wolfer@fediscience.org
#TIL that #RStudio supports multiple levels of code sections. The level depends on the number of # signs at the beginning of the line.
# First Level -----
## Second level ------
This is also reflected in the document outline you get with Cmd Shift O (on a Mac, I guess it's Ctrl Shift O anywhere else).
Why did no-one tell me that earlier?!?
#rstats
@datascience@genomic.social @datascience@genomic.socialMake sure your code follows a consitent style using the {lintr} package. #rstats
@datascience@genomic.social @datascience@genomic.social{annotater}: Annotate package load calls, so we can have an idea of the overall purpose of the libraries we’re loading: #rstats
@datascience@genomic.social @datascience@genomic.social @datascience@genomic.social @datascience@genomic.socialLets be honest, we spend too much time cleaning data. {janitor} can help with that: #rstats #datasciece
@datascience@genomic.social @datascience@genomic.social{testthat} is great for automatic testing. Here are some tricks for the heavy user: #rstats
@datascience@genomic.socialFunction-oriented Make-like declarative workflows for R #rstats
@datascience@genomic.social{ivs} makes it easier to work with intervals: #rstats
@datascience@genomic.social @datascience@genomic.social @datascience@genomic.socialBeside the {report} package (yesterdays note) there are more tools in the easystats collection. #rstats
@datascience@genomic.socialSometimes (often) one ends up needing to run older versions of R using older versions of packages. Evercran might be just the tool to help with that: #RStats…
@datascience@genomic.socialTidy Modeling with R: #rstats #machinelearning
@datascience@genomic.social @datascience@genomic.socialExtract tables from pdfs with {tabulapdf} #rstats #datasciece
@datascience@genomic.socialAutomatically describe data and models as text using the {report} package. #rstats
@datascience@genomic.socialAdd some swag to your ggplots, with fontawesome symbols and colors: #rstats
@datascience@genomic.socialIt has happened to the best of us: You forgot the name of a function or the package that function was in but you are sure its there somewhere and does exactly what you need! Introduce {forgot}, it helps you find that function: https://github.com/parmsam/forgot
@datascience@genomic.social @datascience@genomic.social @datascience@genomic.social{purrr} has some lesser known functions that make handling of failing function calls easier: safely, quietly, possibly: #rstats
@datascience@genomic.social{nplyr} has helper functions to work on nested dataframes: #rstats #datascience
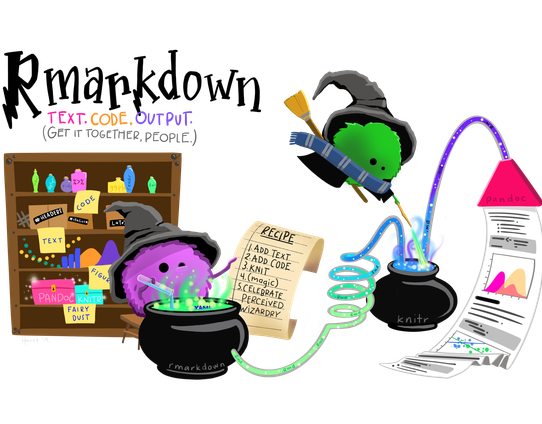
@datascience@genomic.socialInteractive resizing of picture and table content in Rmd and Quarto: #rstats
@datascience@genomic.socialPolars is a lightning fast DataFrame library/in-memory query engine with parallel execution and cache efficiency. And now you can use is with the tidyverse syntax: #rstats
@datascience@genomic.social @datascience@genomic.socialIm using case_when() quite a lot, case_match() is new to me: #rstats
@datascience@genomic.socialThe {conflicted} package makes sure that namespace conflicts are solved explicitly and prevents unpleasent surprises: #rstats
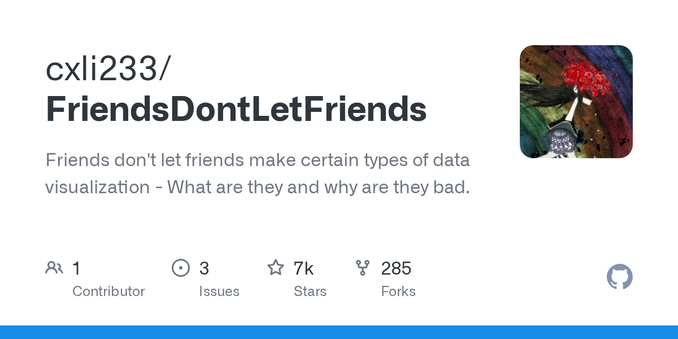
@datascience@genomic.socialFriends Don't Let Friends Make Bad Graphs! Do you agree with the examples of bad graphs and the alternatives Chenxin Li (@chenxinli2.bsky.social) lists at #RStats
@datascience@genomic.socialLinear programs help to find optimal solutions based on a set of constrains. I used {ompr} before, but the new package {tidyLP} looks promising and integrates with the tidyverse. #rstats #linearprograms #optimization
@datascience@genomic.social @datascience@genomic.social{piggyback} makes it easier to attach large files (e.g. input data) to code in github repos: #rstats
@datascience@genomic.socialI have a habbit of making (too) many (small) packages for functionality that might be reused in different context. {box} might be an alternative by making scripts into modlues that can be loaded: #RStats
@datascience@genomic.socialThere are many situations were you need access to different R versions: rig is a way to manage them #rstats
@datascience@genomic.socialPrimer to get you started with Optimization and Mathematical Programming in R #rstats
@datascience@genomic.socialNot sure any longer which libraries your script actually needs? #rstats
@datascience@genomic.social @datascience@genomic.socialThe fastverse is a suite of complementary high-performance packages for statistical computing and data manipulation in R. #rstats
@datascience@genomic.social @datascience@genomic.socialCustomize what happens when you start R: #rstats #environment
@datascience@genomic.social{spiralize} can be used to highlight cyclic data, e.g. multi year time series. #rstats
@datascience@genomic.socialEasier debugging of piped analyses in R: https://github.com/MilesMcBain/breakerofchains by @…
@datascience@genomic.socialA pictures says more than 1000 words. How much more can an audio representation of your data tell you? #rstats
@datascience@genomic.socialA template for data analysis projects structured as R packages (or not) https://github.com/Pakillo/template by @…
@datascience@genomic.socialEasier debugging of piped analyses in R: https://github.com/MilesMcBain/breakerofchains by @…
@datascience@genomic.socialThere are frameworks like {golem} and {rhino} to make shiny development more robust, but I like the concept of {shinytest2} in providing a testing framework for pure shiny. https://rstudio.github.io/shinytest2/index.html
@datascience@genomic.socialIf you set limits for a scale (e.g. x-axis) in ggplot, how would you like data outside of that range be handled? There is the oob parameter for that and a set of functions to use with it: https://scales.r-lib.org/reference/oob.html
@datascience@genomic.socialFollow along when @… walks you through how she tackles a new dataset: https://www.youtube.com/c/JuliaSilge
@datascience@genomic.social{ggblanket}, a wrapper around #ggplot for quick, explorative plots with sensible defaults and less code. https://davidhodge931.github.io/ggblanket/