 @frankel@mastodon.top
2026-05-22 17:20:56
Exiting the Billionaire Castle
#EuropeanSovereignty
 @presseportal_pol_NDS@frawas.de
2026-05-22 09:48:17
POL-NI: Warmsen - Unbekannte entwenden Dachrinnen Warmsen (ots) - (KEM) In der Zeit von Dienstag, den 19.05.2026, ca. 20.30 Uhr, bis Mittwoch, ca. 11.15 Uhr haben bislang unbekannt Täter ca. 54m Dachrinnen aus Kupfer von einem denkmalgeschützten Gebäude an der Bohnhorster Straße in Warmsen ... https://www.presseportal.de…
 @kubikpixel@chaos.social
2026-06-19 06:30:59
Ich lasse es mal unbemerkt stehen:
«Angebliche China-Verbindungen von SK Telecom alarmierten US-Beamte und lösten Anthropic-Krise aus:
[…] Der südkoreanische Telekommunikationsriese SK Telecom erhielt Zugang zu #Mythos über Anthropics Partnerprogramm Project Glasswing. #US-Beamte waren alarmiert, wei…

 @cdarwin@c.im
2026-07-12 20:33:09
When the Nazis set out to legally disenfranchise and discriminate against Jewish citizens,
they weren’t just coming up with ideas out of thin air.
They closely studied the laws of another country.
According to James Q. Whitman, author of Hitler’s American Model, that country was the United States
In 1935, Nazi Germany passed two radically discriminatory pieces of legislation inspired by American laws:
the Reich Citizenship Law and the Law for the Protection o…
 @aardrian@toot.cafe
2026-06-15 16:15:28
Playing around with an idea.
Structured alt:
https://cdpn.io/aardrian/debug/NPdrONq/
Source:
https://codepen.io/aardrian/pen/NPdrO…

 @andres4ny@social.ridetrans.it
2026-05-12 18:25:37


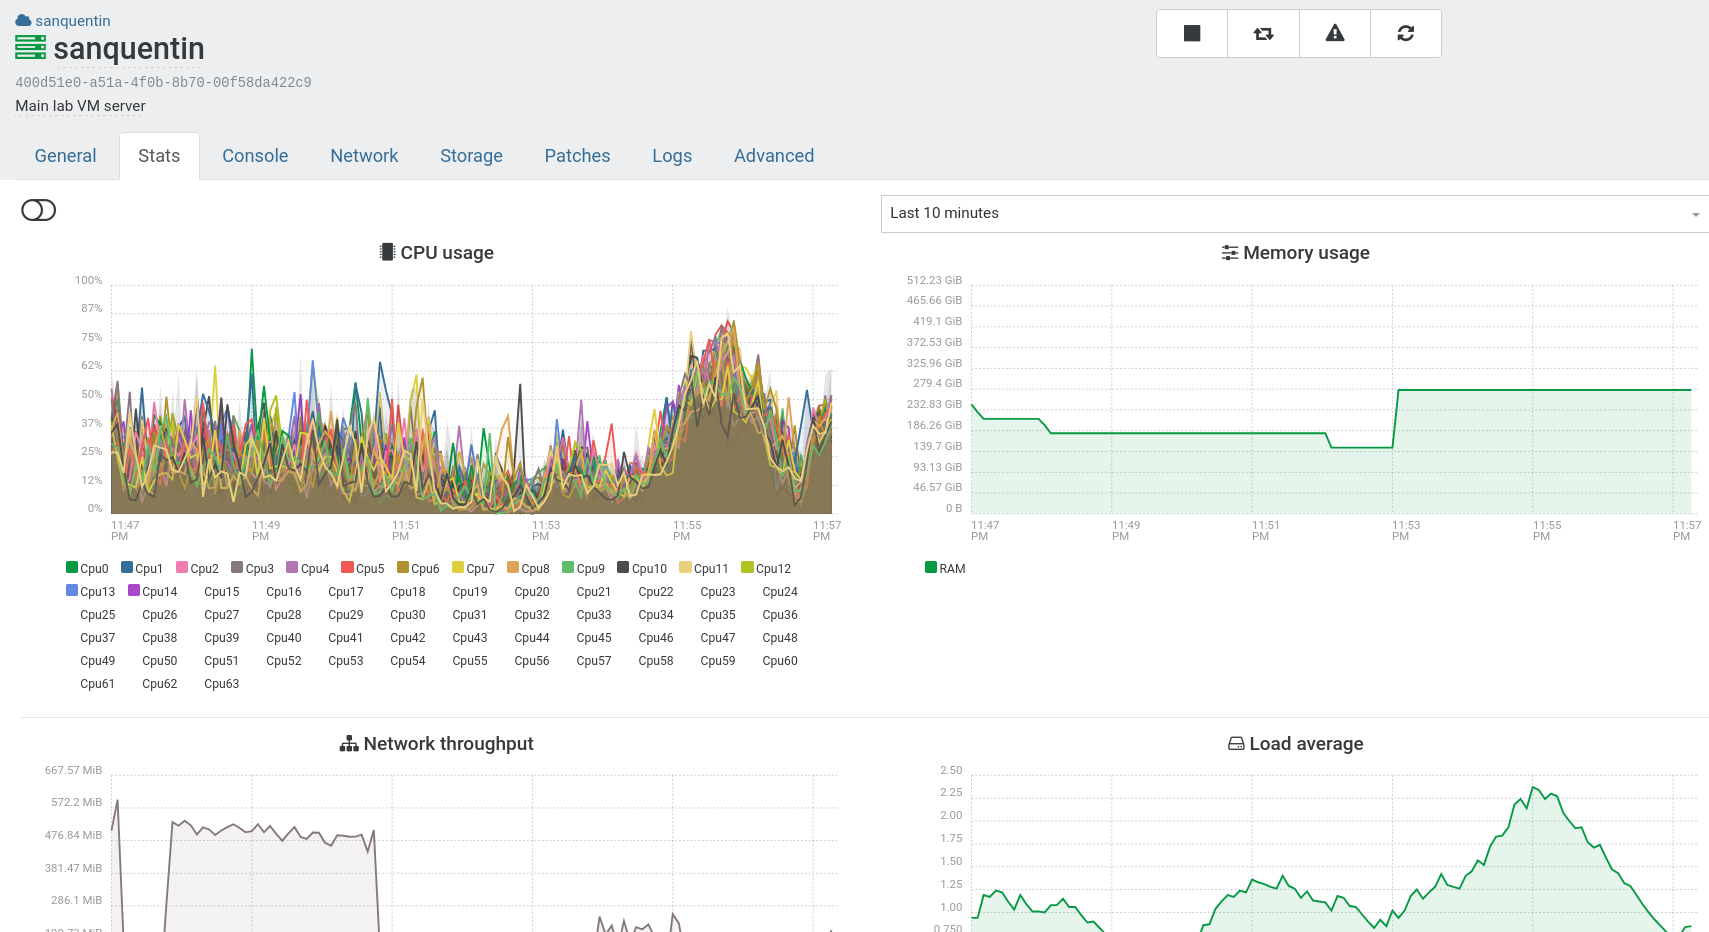
 @azonenberg@ioc.exchange
2026-04-25 07:21:20
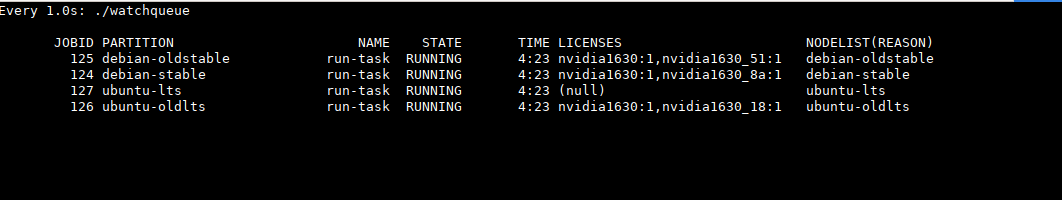
Set up a fourth CI builder instance running the freshly released Ubuntu Resolute / 26.04. I might eventually put a GPU on it, but for the moment it's using llvmpipe (I do want to run some tests without a GPU just to make sure that config works).
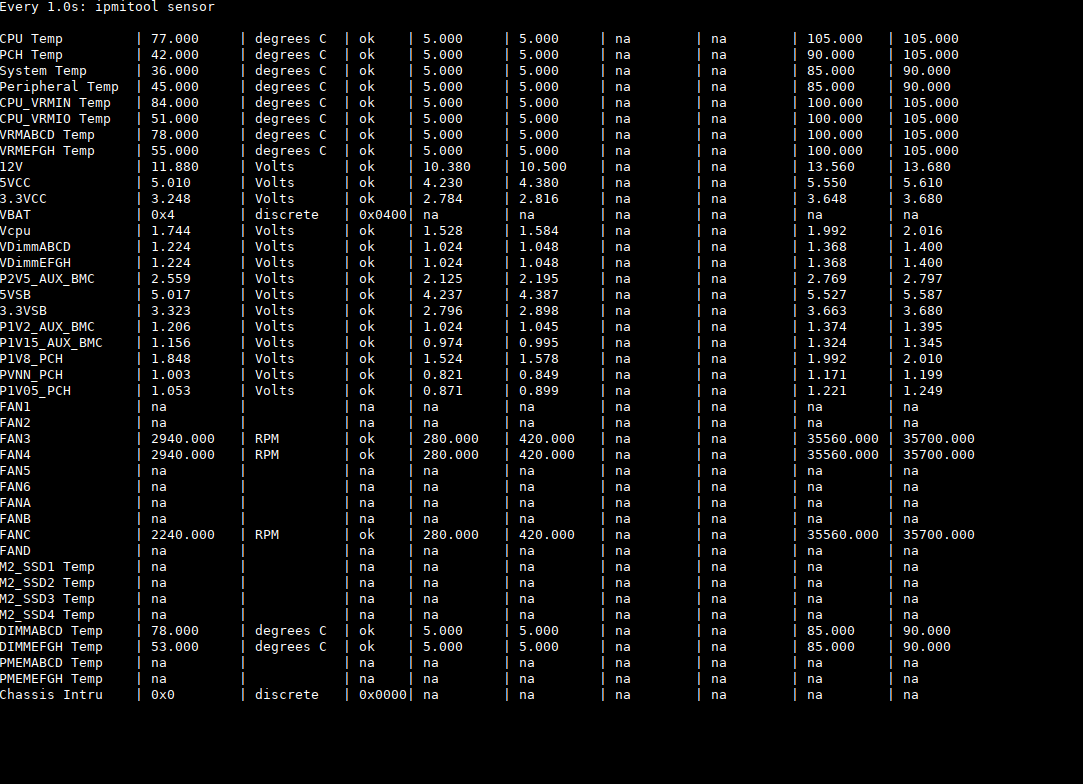
Temps were acceptable, but on the warm side, maxing out just under 80C CPU temp. Interestingly the DIMMs and VRMs on one side are much hotter than the others. I need to go back and look at the motherboard diagram, perhaps I could do some 3D…
 @wraithe@mastodon.social
2026-05-02 23:06:08
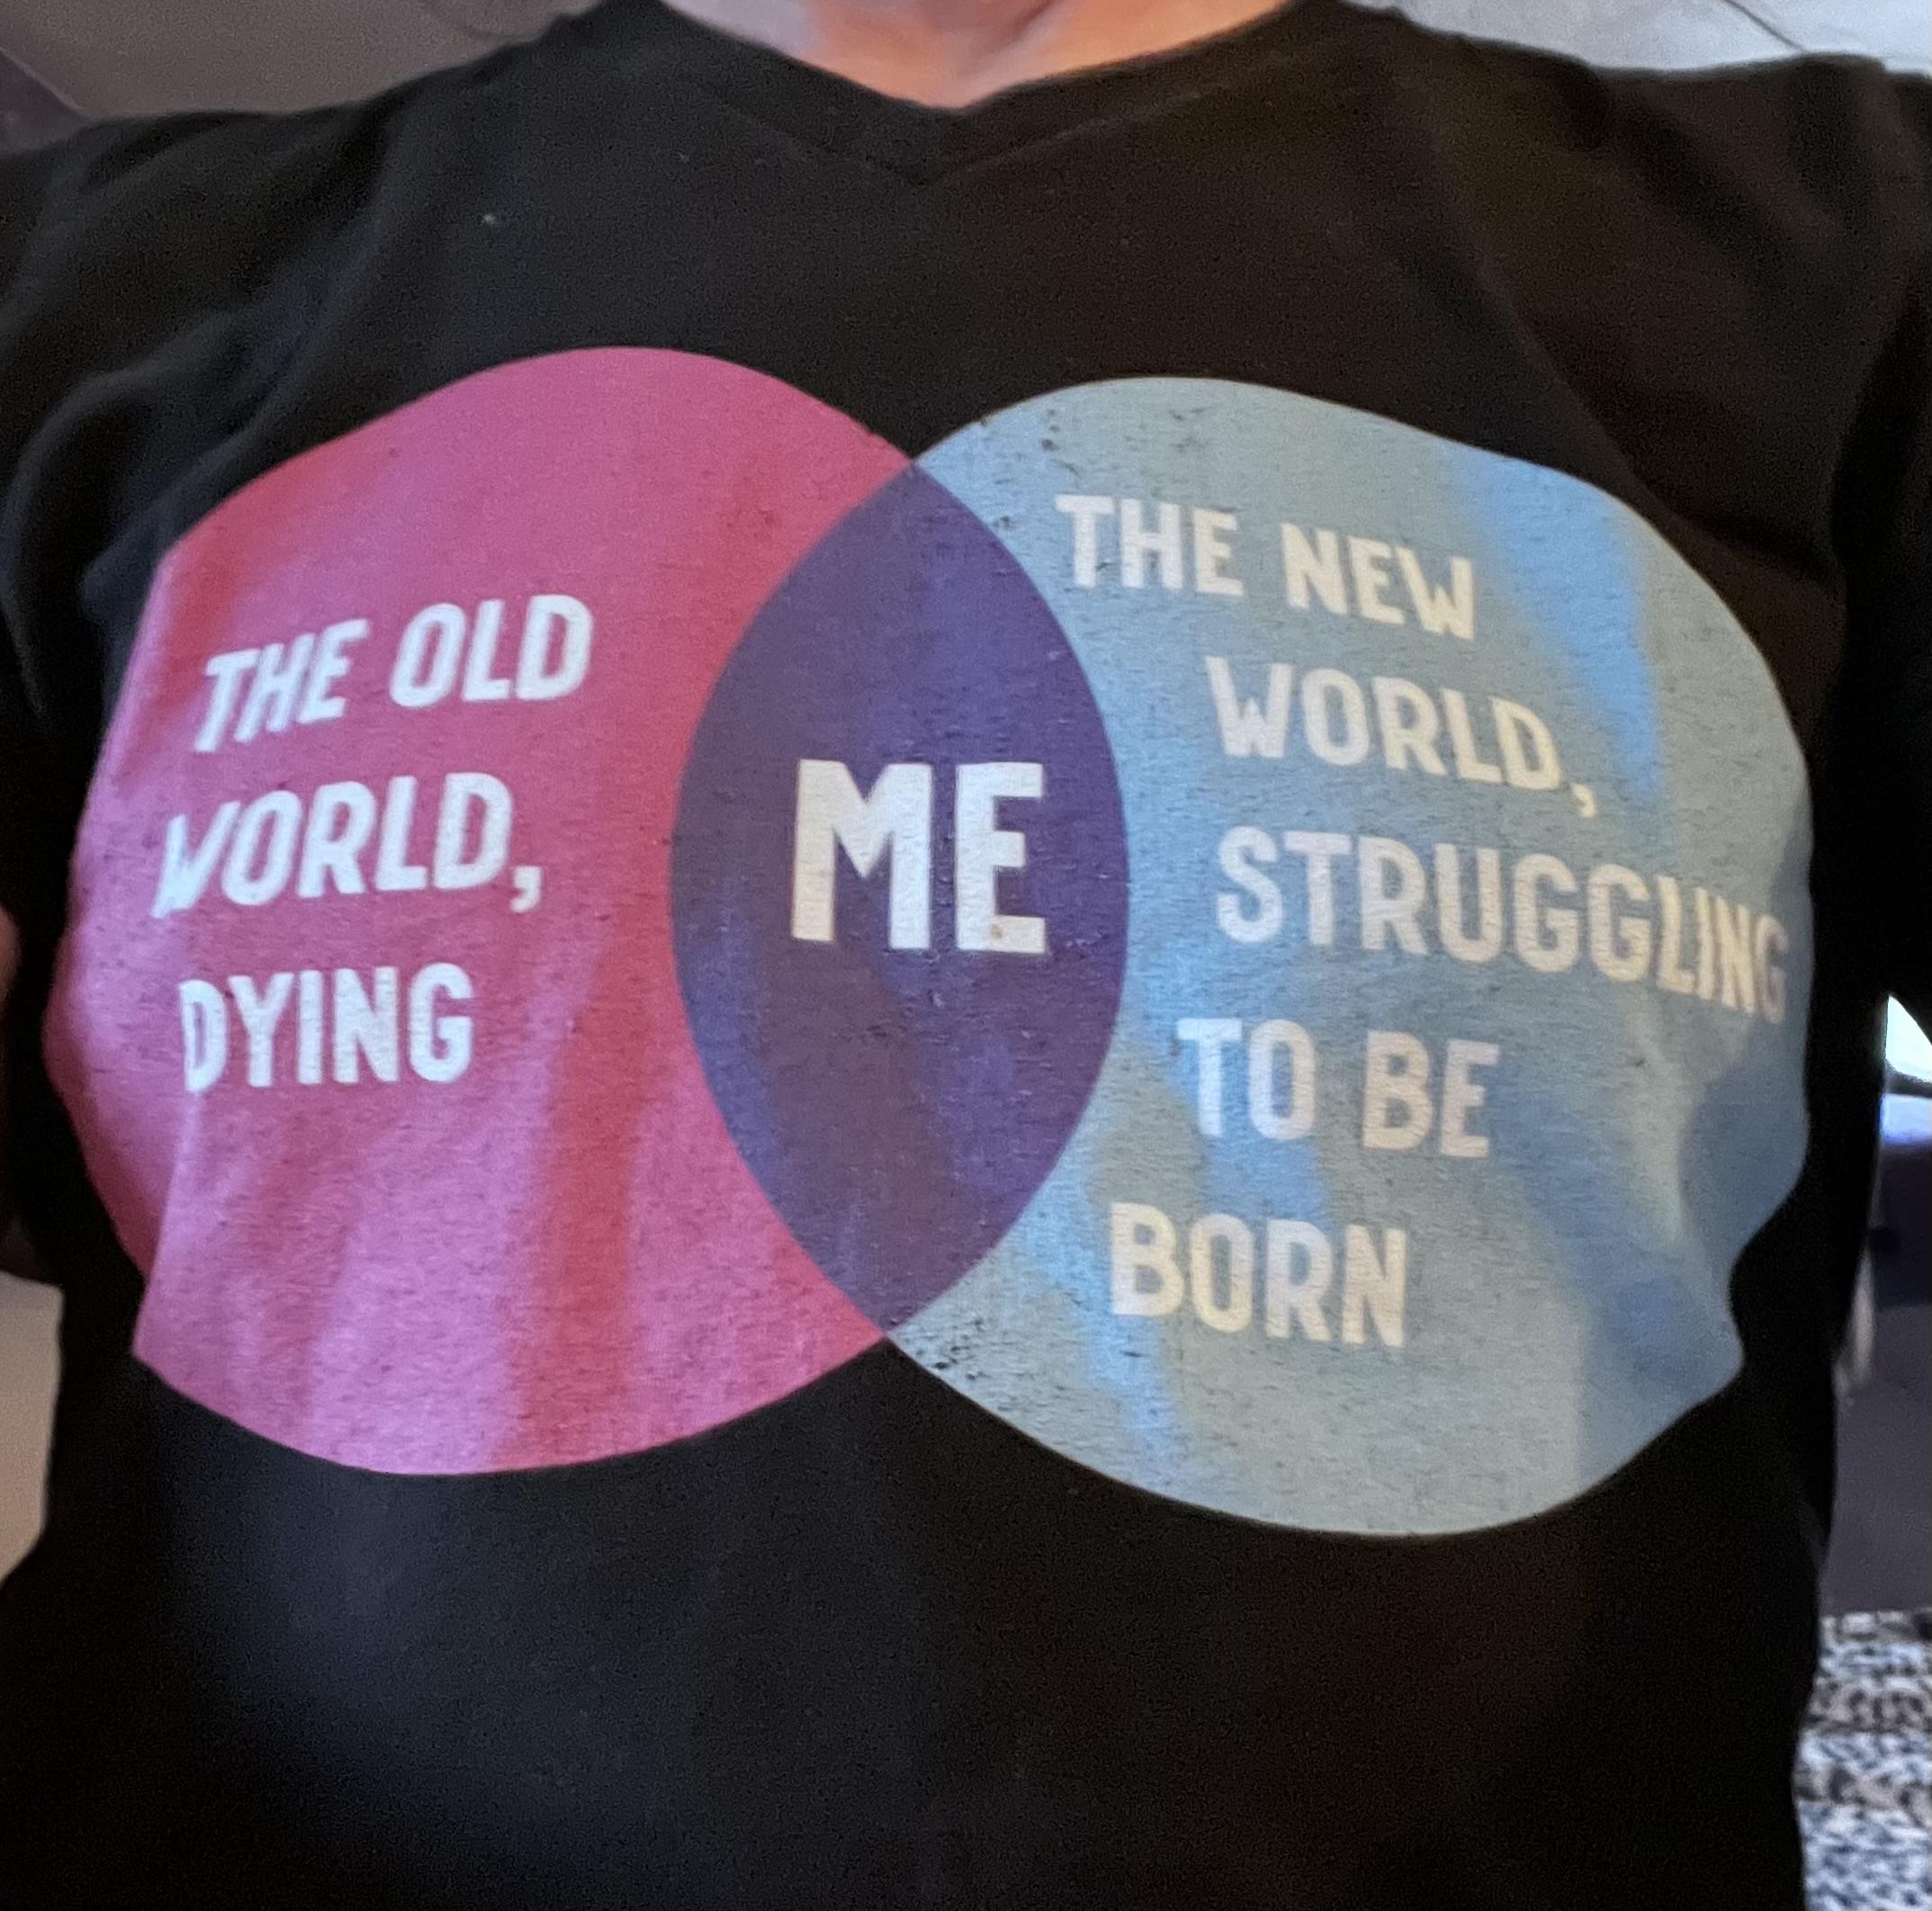
One of my favorite T-shirts is starting to wear, so now I have to try and remember where I got it AND hope the person is still selling them
 @Sustainable2050@mastodon.energy
2026-05-26 04:54:05
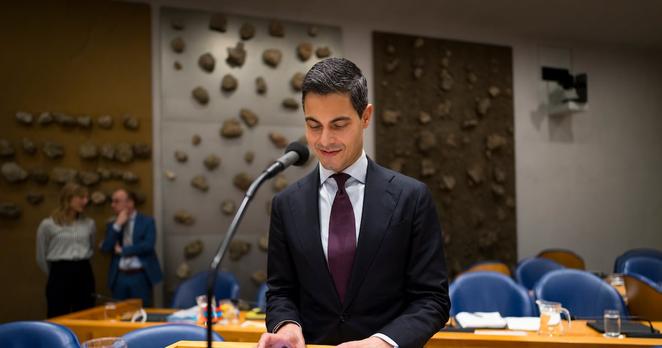
Communication directors of 12 Dutch ministries: government should leave X, to stop exposing citizens to desinformation, racism, discrimination, misogyny, and antisemitism.
https://www.volkskrant.nl/politiek/topambtenaren-in-intern…
 @tinoeberl@mastodon.online
2026-07-08 20:22:02
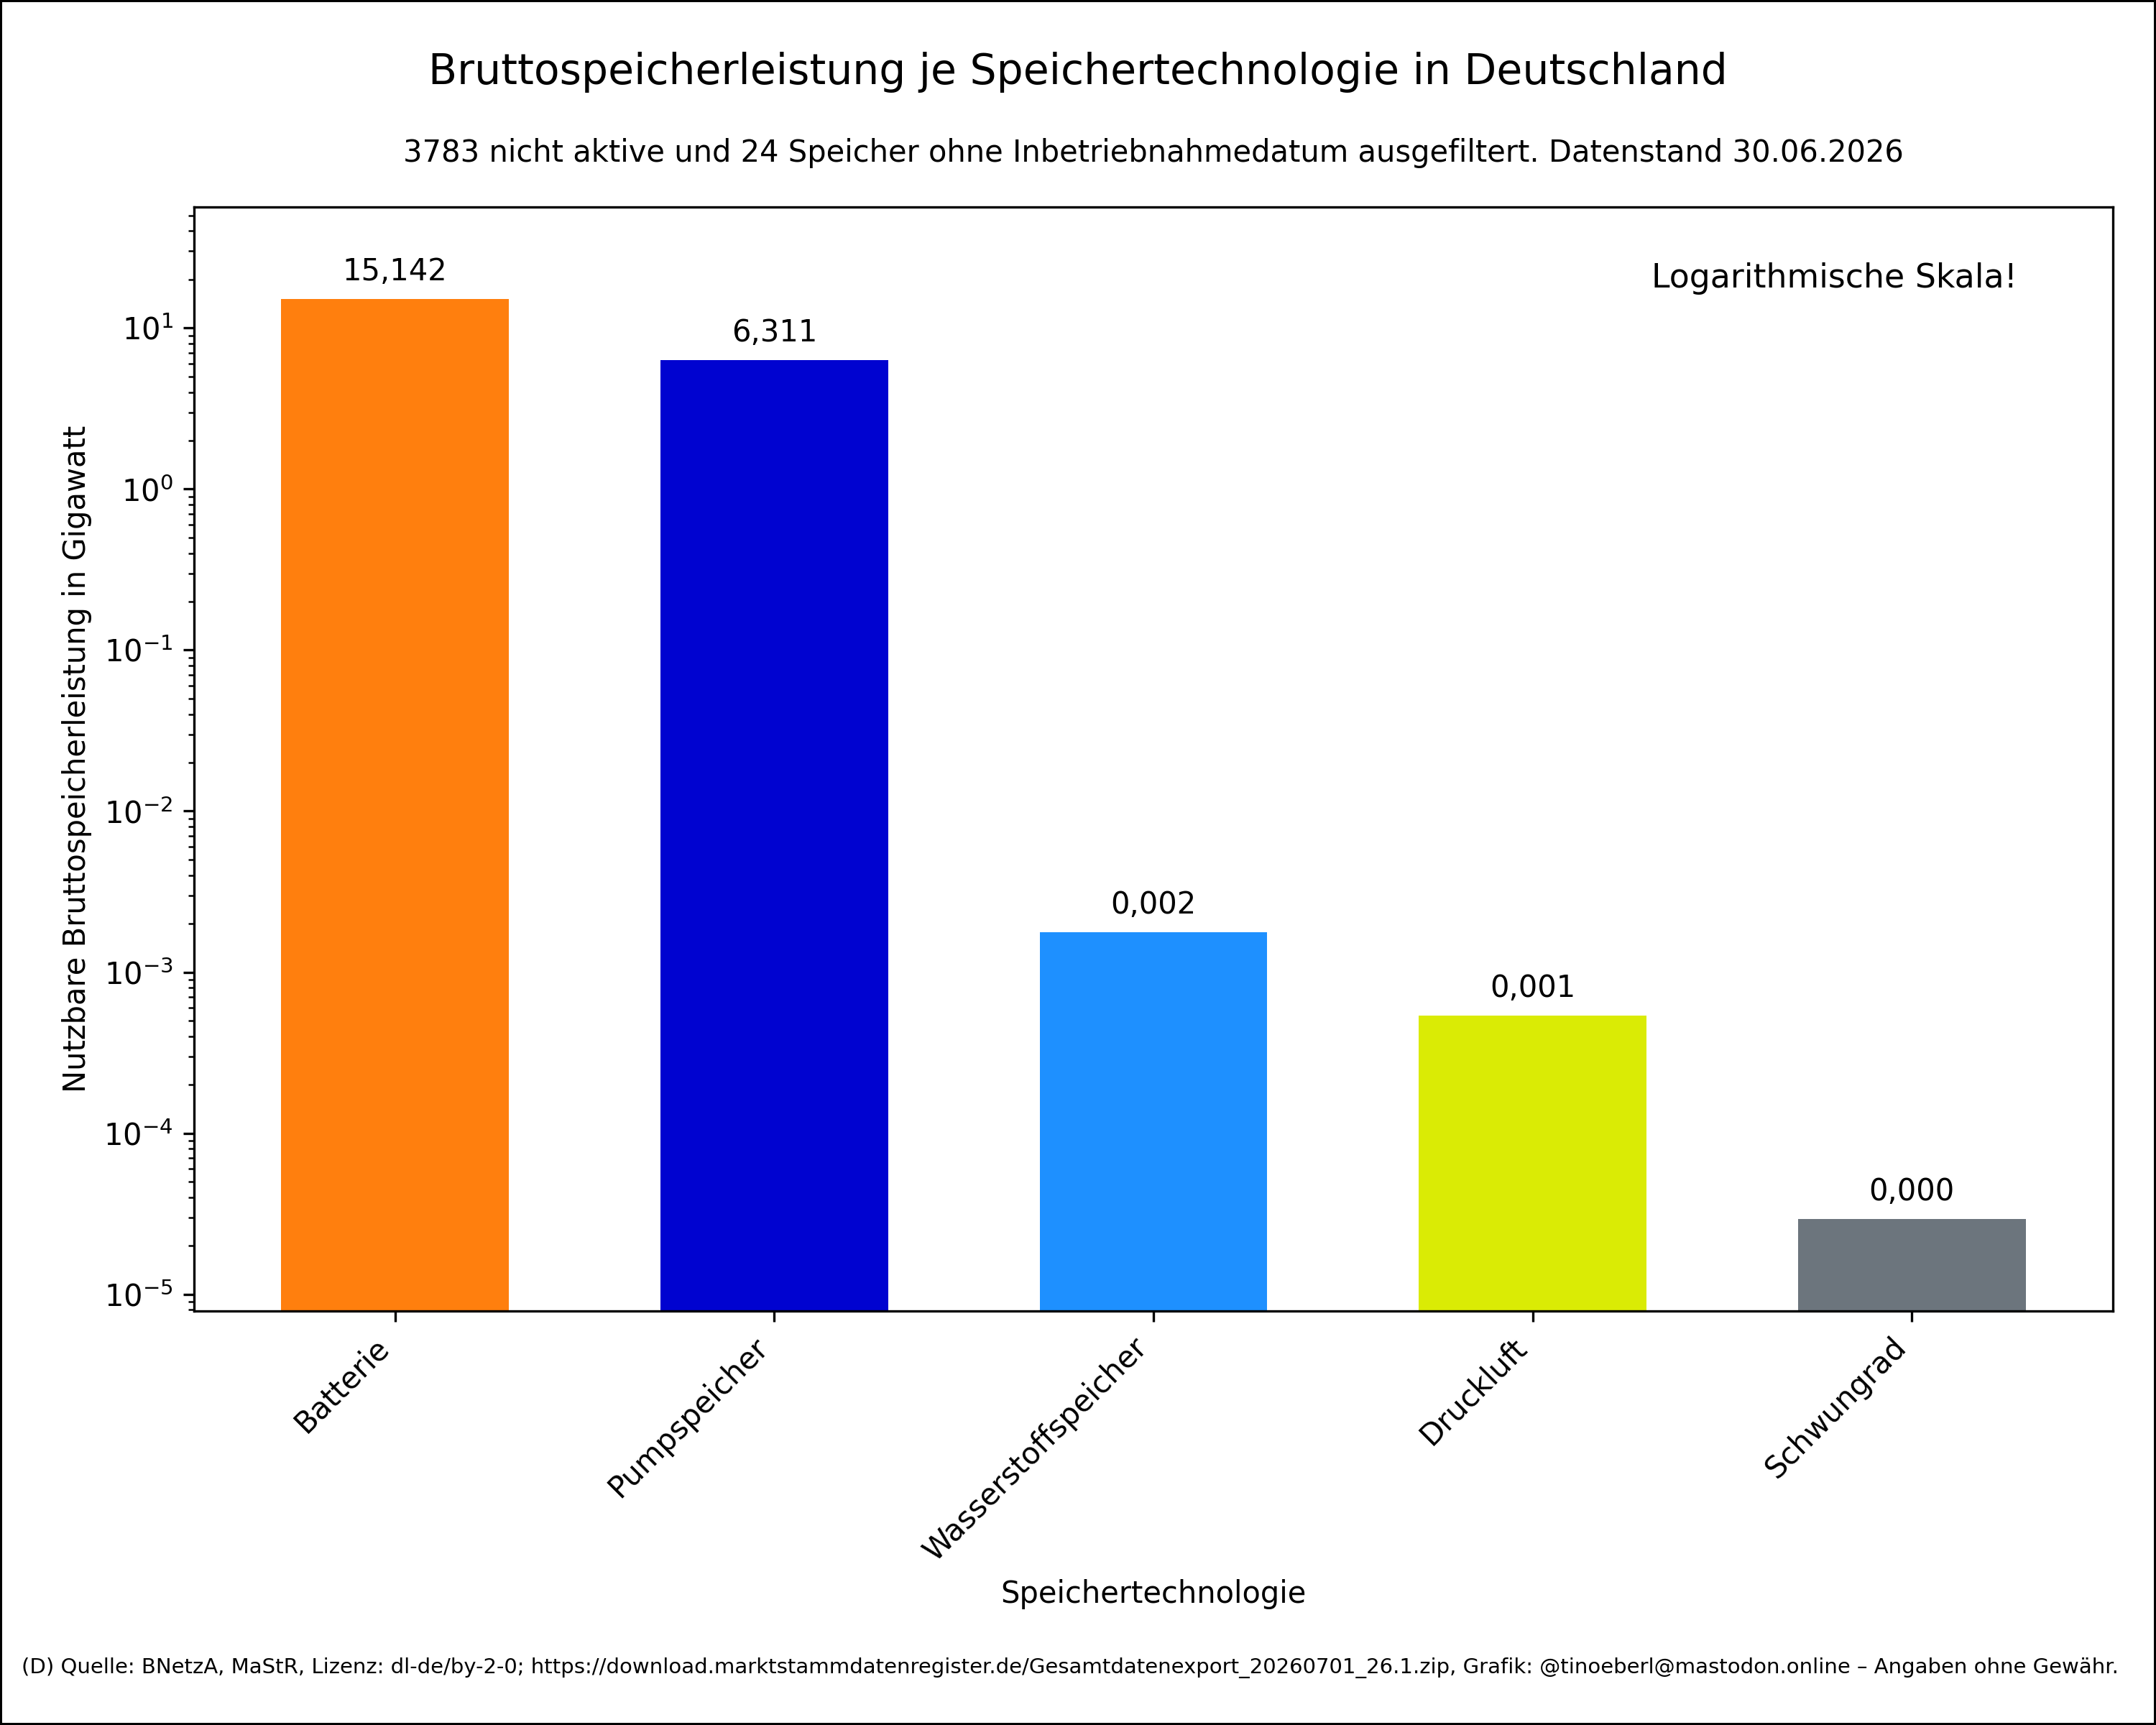
#Bruttospeicherleistung je #Speichertechnologie in #Deutschland mit Stand vom 30.06.2026.
Betrachtet werden Datensätze mit Betriebsstatus „aktiv“ und vorhandenem Inb…