 @Techmeme@techhub.social
2026-08-19 10:16:22
Google Cloud is deploying context-creating AI agents within its tools to automate tasks handled by forward-deployed engineers; Google is hiring hundreds of FDEs (Kevin McLaughlin/The Information)
https://www.theinformation.com/articles/google-says-a…

 @aral@mastodon.ar.al
2026-07-31 12:58:23
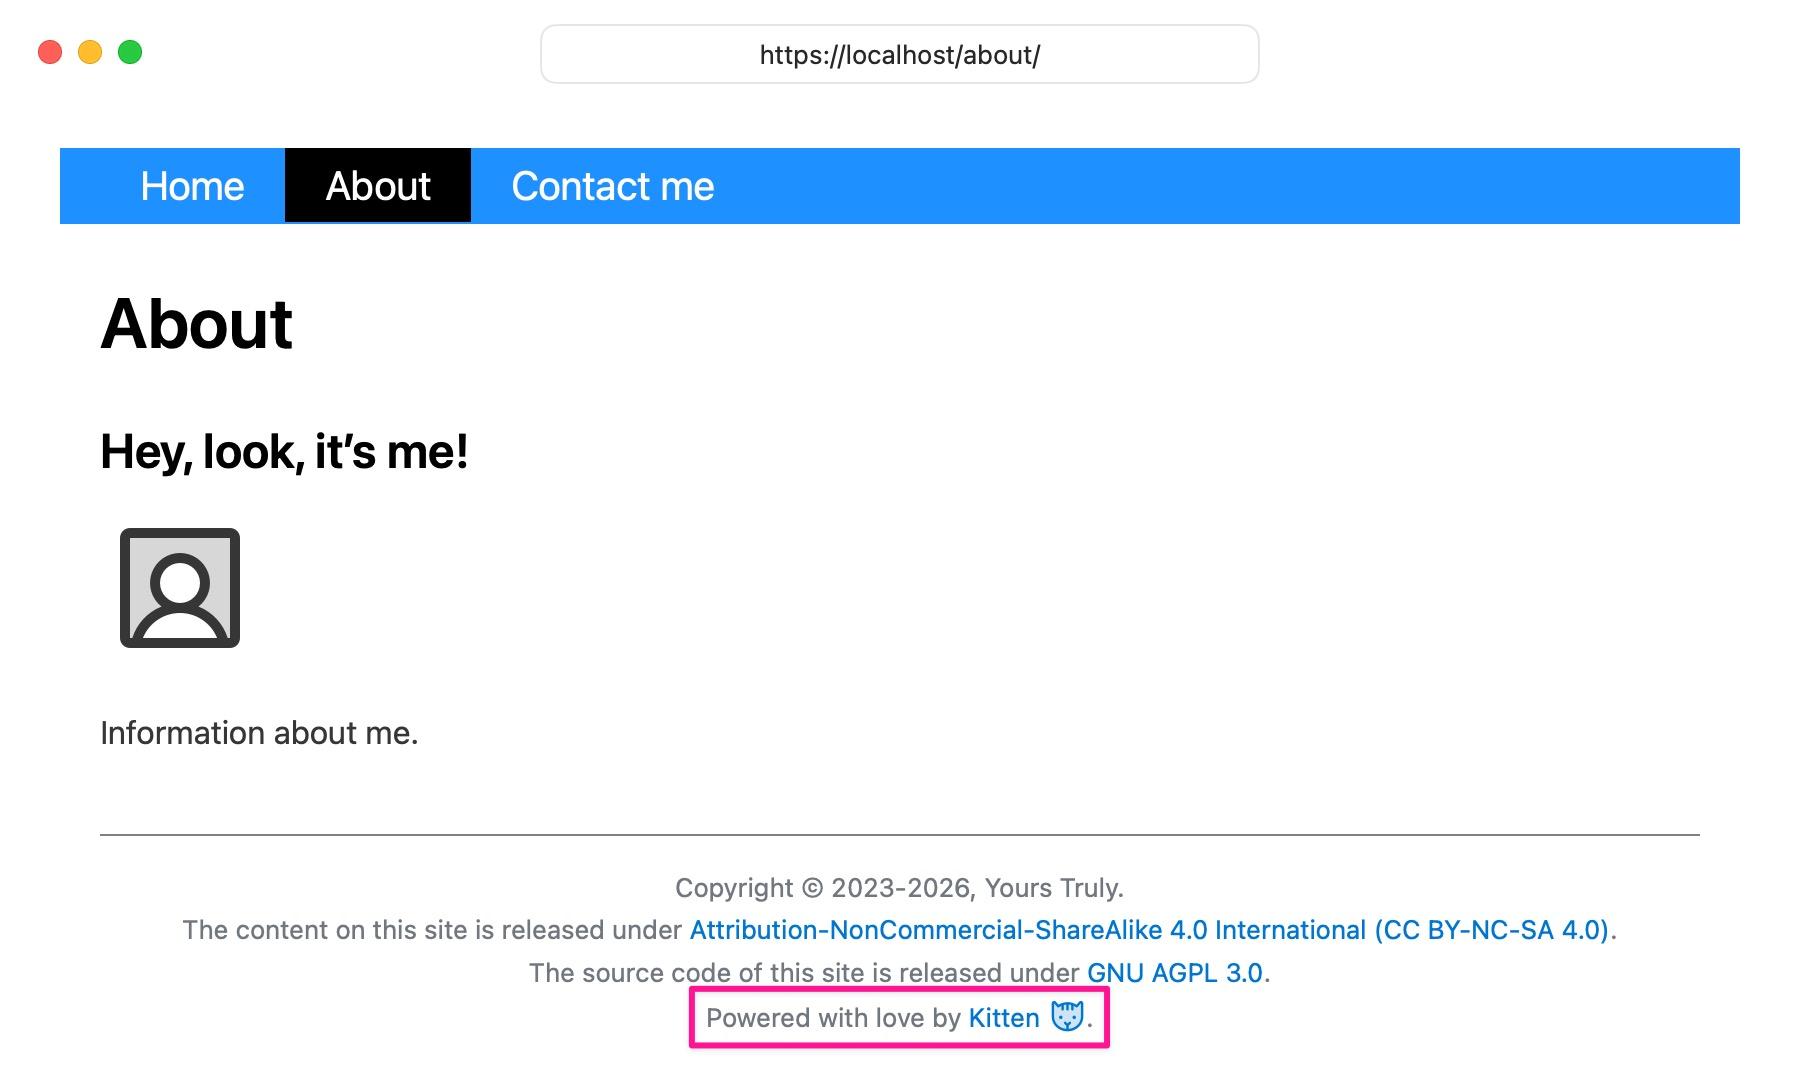
That feeling when your renderer can handle a component that outputs HTML inside link text in Markdown that’s embedded in HTML.
(Yes, I’m bragging.)
#Kitten #SmallWeb #SmallTech
.
Full (visible) code:
export default () => kitten.html`
<footer>
<markdown>
Copyright (c) 2023-${new Date().getFullYear()}, Yours Truly.
T…](https://s3-eu-central-1.amazonaws.com/mastodon-aral/media_attachments/files/117/014/705/153/360/218/original/229421ba28ff29f6.jpeg)
 @azonenberg@ioc.exchange
2026-08-24 06:38:03
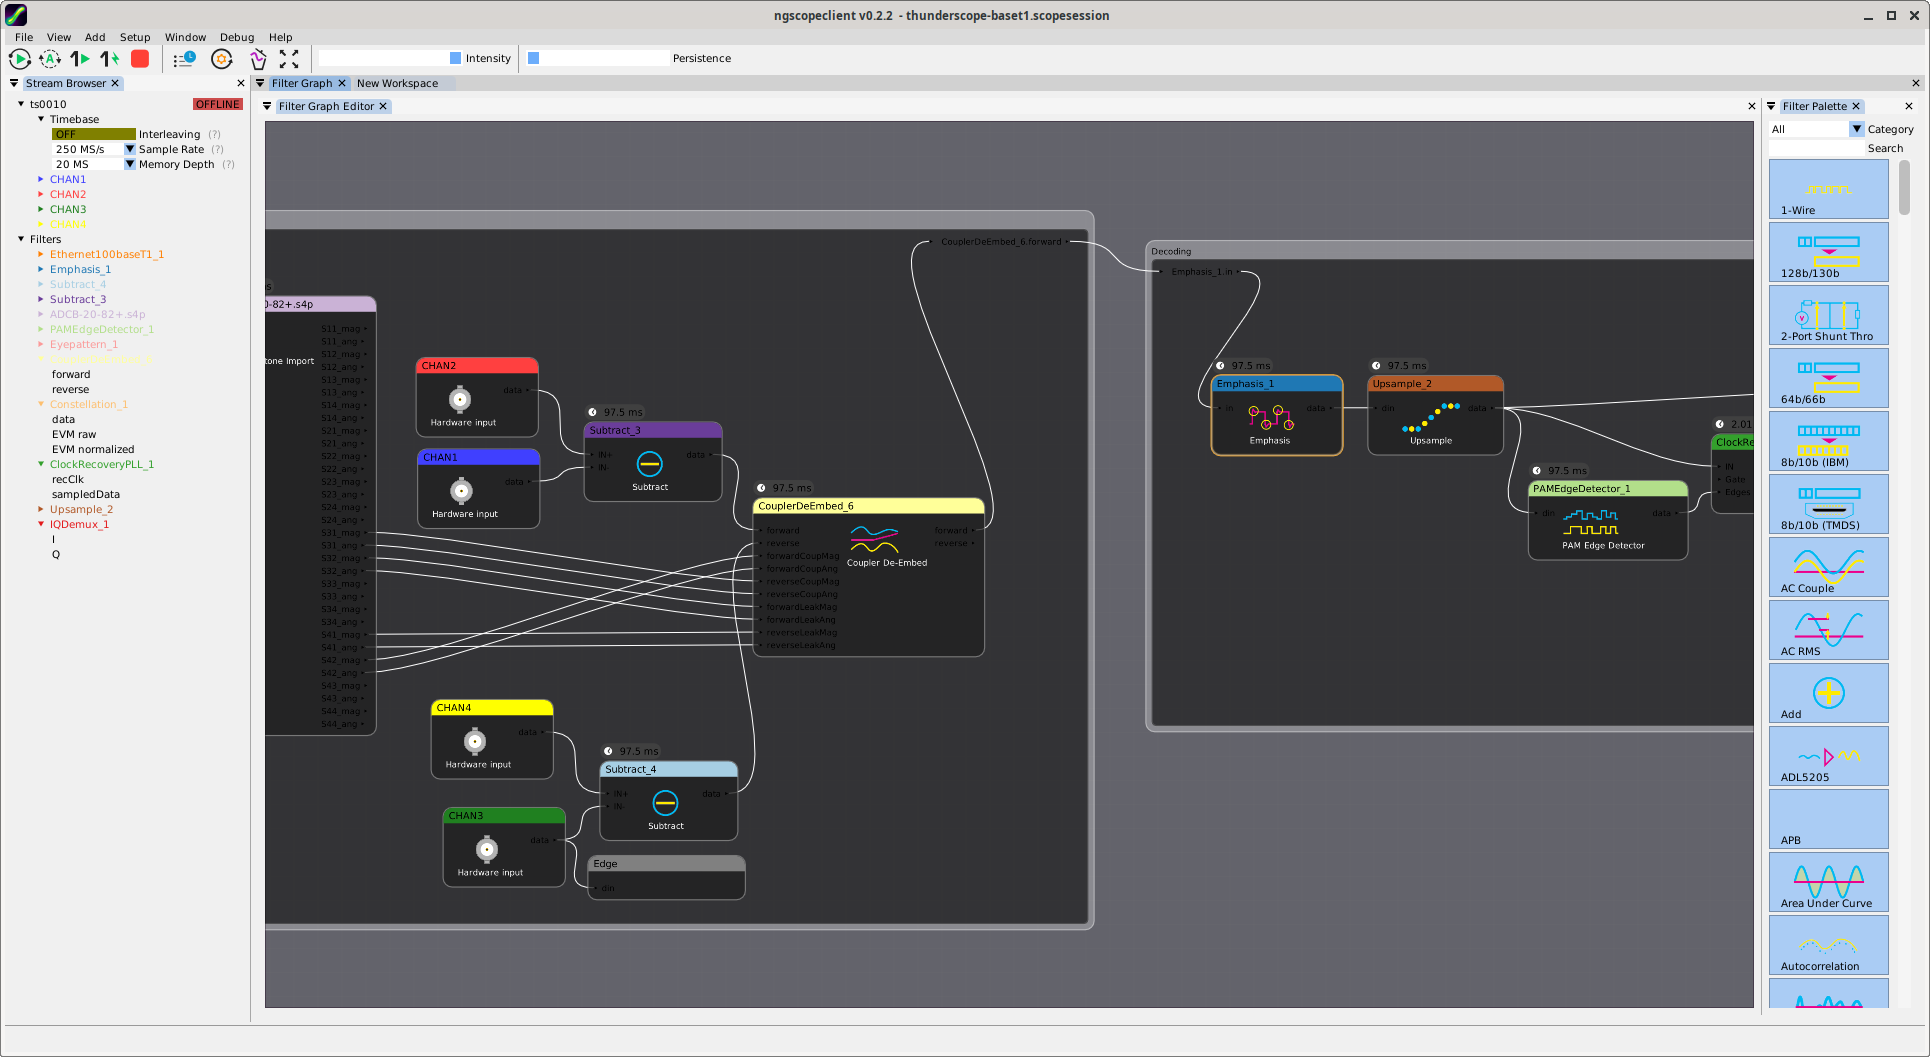
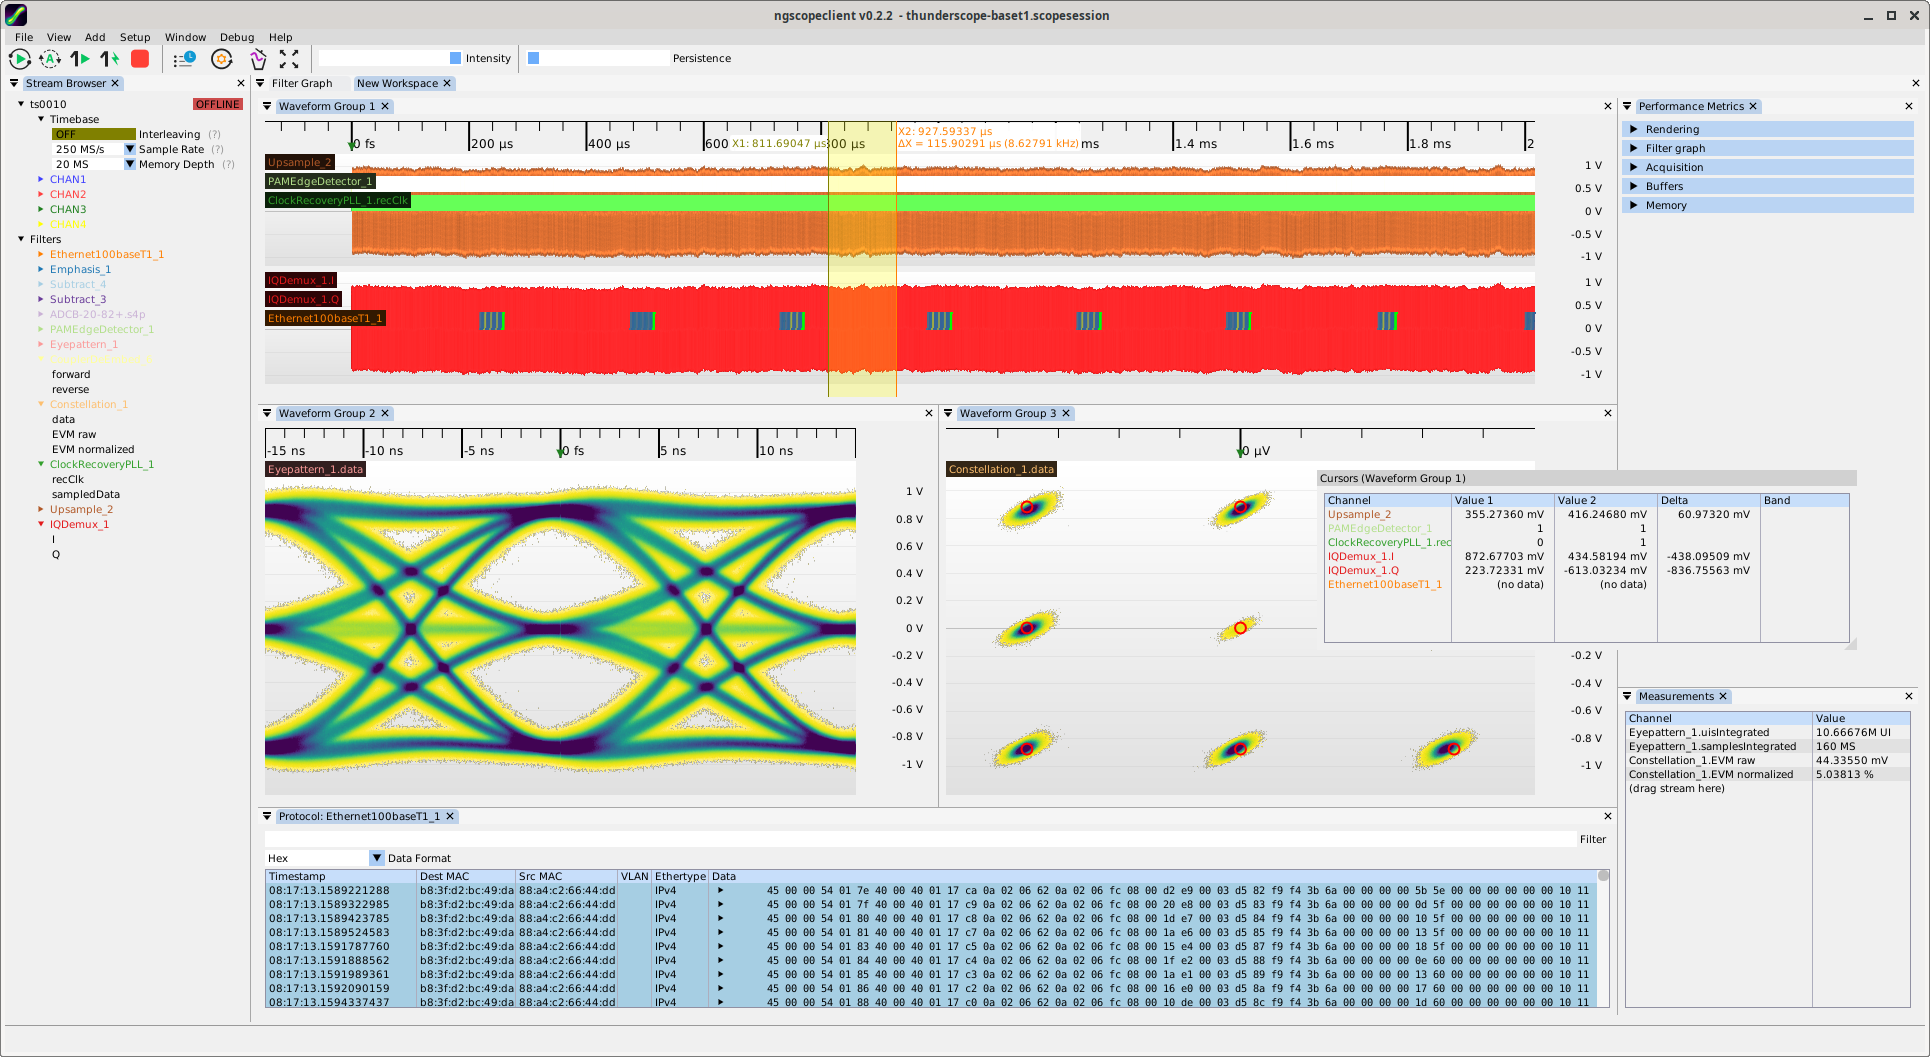
More progress toward a usable light mode theme in ngscopeclient.
Not pushed yet, but color preferences are now scoped to the GUI theme setting so when you change the theme, different sets of preferences are applied.
I'm gradually going through the code finding spots that need to be themed differently and picking sane light-mode default colors, which will take a bit longer.
One thing I'm not yet sure about is how to handle channel colors; the default values for instr…
 @datascience@genomic.social
2026-08-24 10:00:01
If you set limits for a scale (e.g. x-axis) in ggplot, how would you like data outside of that range be handled? There is the oob parameter for that and a set of functions to use with it: https://scales.r-lib.org/reference/oob.html
 @zachleat@zachleat.com
2026-09-17 16:02:35
@… @… a slightly different issue there! We already handle `Date` instances for the special `date` property (whether yaml parses them by default or not is the js-yaml change) and String (previous luxon, now this new package)
(Most …
 @dassascha@norden.social
2026-10-02 08:27:40
Lange Zeit hatte #xrdp bei mir nicht mehr funktioniert, das gefühlt mit Updates der beteiligten Packages zu tun hatte, aber weit gefehlt.
Auf https://forums.developer.nvidia.com/t/

 @isonno@mastodon.social
2026-09-14 21:42:51
My wife complained her iPhone 17 display was "turning pink". Fishing through settings menus revealed Accessibility > Display > Color Filters set to pink. I turned it off, phone normal.
But the phone kept turning pink. Online searches revealed the default "Accessibility action" for hitting the side button 3x was to turn *on* the color filter (easy to do by accident just handling the phone).
Who at Apple thought this was a useful default??
#iphone17