 @michabbb@social.vivaldi.net
2025-12-13 22:39:45
@michabbb@social.vivaldi.net @penguin42@mastodon.org.uk
'nut' is a UPS monitor program; you can configure your host to switch off when your UPS is running low and change settings on the UPS and monitor charge. The 'N' stands for Network - so you can do a lot of things remotely, for example making a bunch of machines speak to one host monitoring the UPS and get them all to shut down.
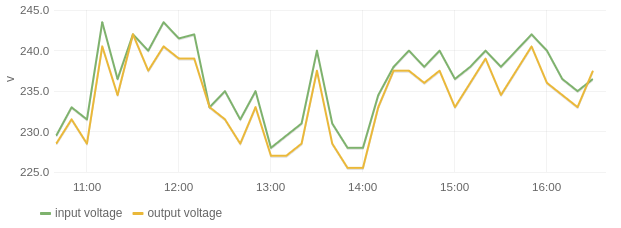
I also use some of my own scripts to feed it into some graphing stuff with Grafana and get pretty line voltage graphs;
 @michabbb@social.vivaldi.net
⚡ Uses up to 30x less RAM and 15x less disk space than Elasticsearch and Grafana Loki. Capacity and performance scale linearly with available resources - runs smoothly on Raspberry Pi and on servers with hundreds of CPU cores and terabytes of RAM. Scales horizontally to hundreds of nodes in cluster mode.
@michabbb@social.vivaldi.net🔧 Zero-config single executable setup - no tuning required for VictoriaLogs or the operating system. Reasonable defaults automatically adjust for available CPU and RAM resources. Much easier to set up and operate compared to Elasticsearch and Grafana Loki.
🔌 Accepts logs from popular collectors including Fluentbit, Fluentd, Logstash, Vector, Promtail, #OpenTelemetry, DataDog Agent…
 @grifferz@social.bitfolk.com
I did a huge grafana upgrade from something like v7.x to v12..3.0 and now the load average is often between 15 and 30!
It's not obvious to me why though.
The VM it's on has 2 CPUs and 8G RAM of which about 4G is free. The average CPU use is just 18%. This would make me suspect iowait but it rarely budges from 0%.
Now, periodically the two CPUs are totally pegged though this only lasts a short time and the service still seems responsive. Maybe it's that?
 @arXiv_astrophHE_bot@mastoxiv.page
Enhancing CTAO Monitoring and Alarm Subsystems in Distributed Environments Using ServiMon
Kevin Munari, Alessandro Costa, Federico Incardona, Emilio Mastriani, Sebastiano Spinello, Stefano Germani, Pietro Bruno
https://arxiv.org/abs/2509.16366