 @memeorandum@universeodon.com
2025-06-24 01:15:42
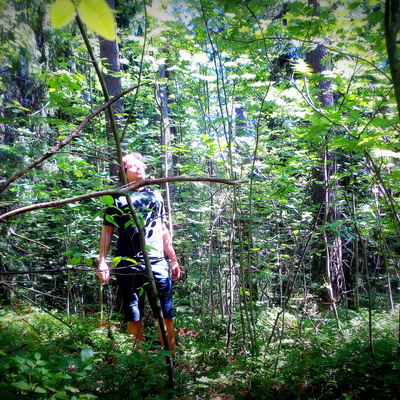
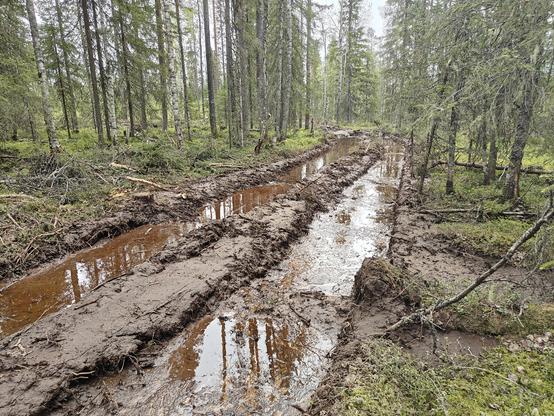
Trump administration plans to rescind rule blocking logging on national forest lands (Associated Press)
https://apnews.com/article/logging-national-forests-0607a77e0ab812ea6fa609034fbb20d9
http://www.memeorandum.com/250623/p153#a250623p153