 @nohillside@smnn.ch
2026-07-18 09:37:18
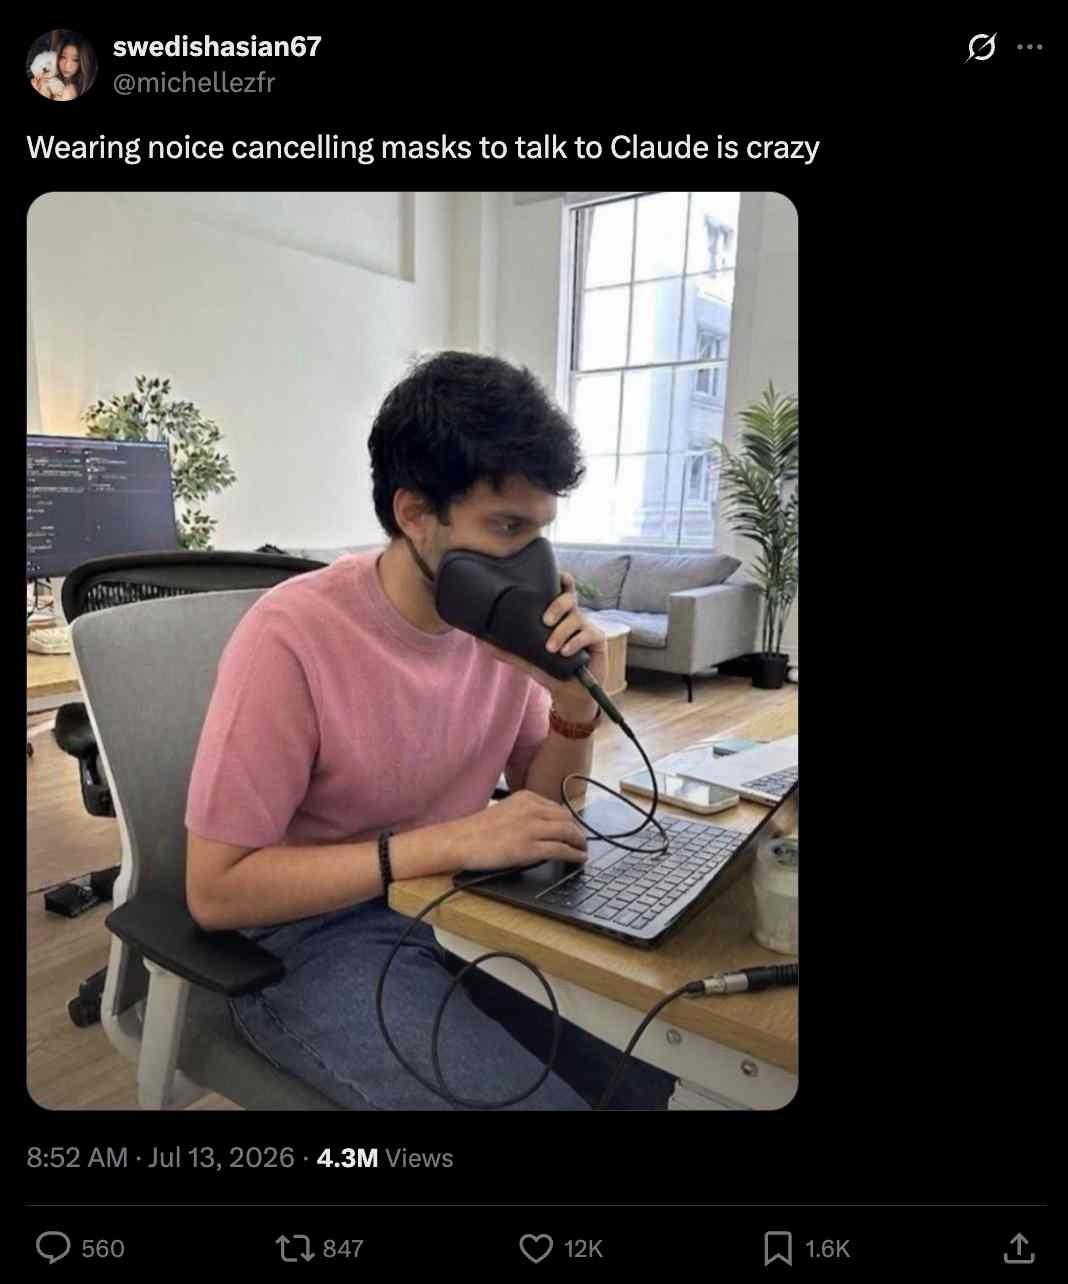
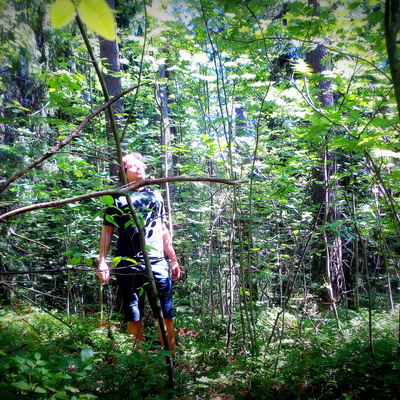
Erinnert ihr euch noch, 2020 , als Masken für viele Teufelszeug waren? KI macht vieles möglich 🤣
 @nohillside@smnn.ch
Erinnert ihr euch noch, 2020 , als Masken für viele Teufelszeug waren? KI macht vieles möglich 🤣
 @netzschleuder@social.skewed.de
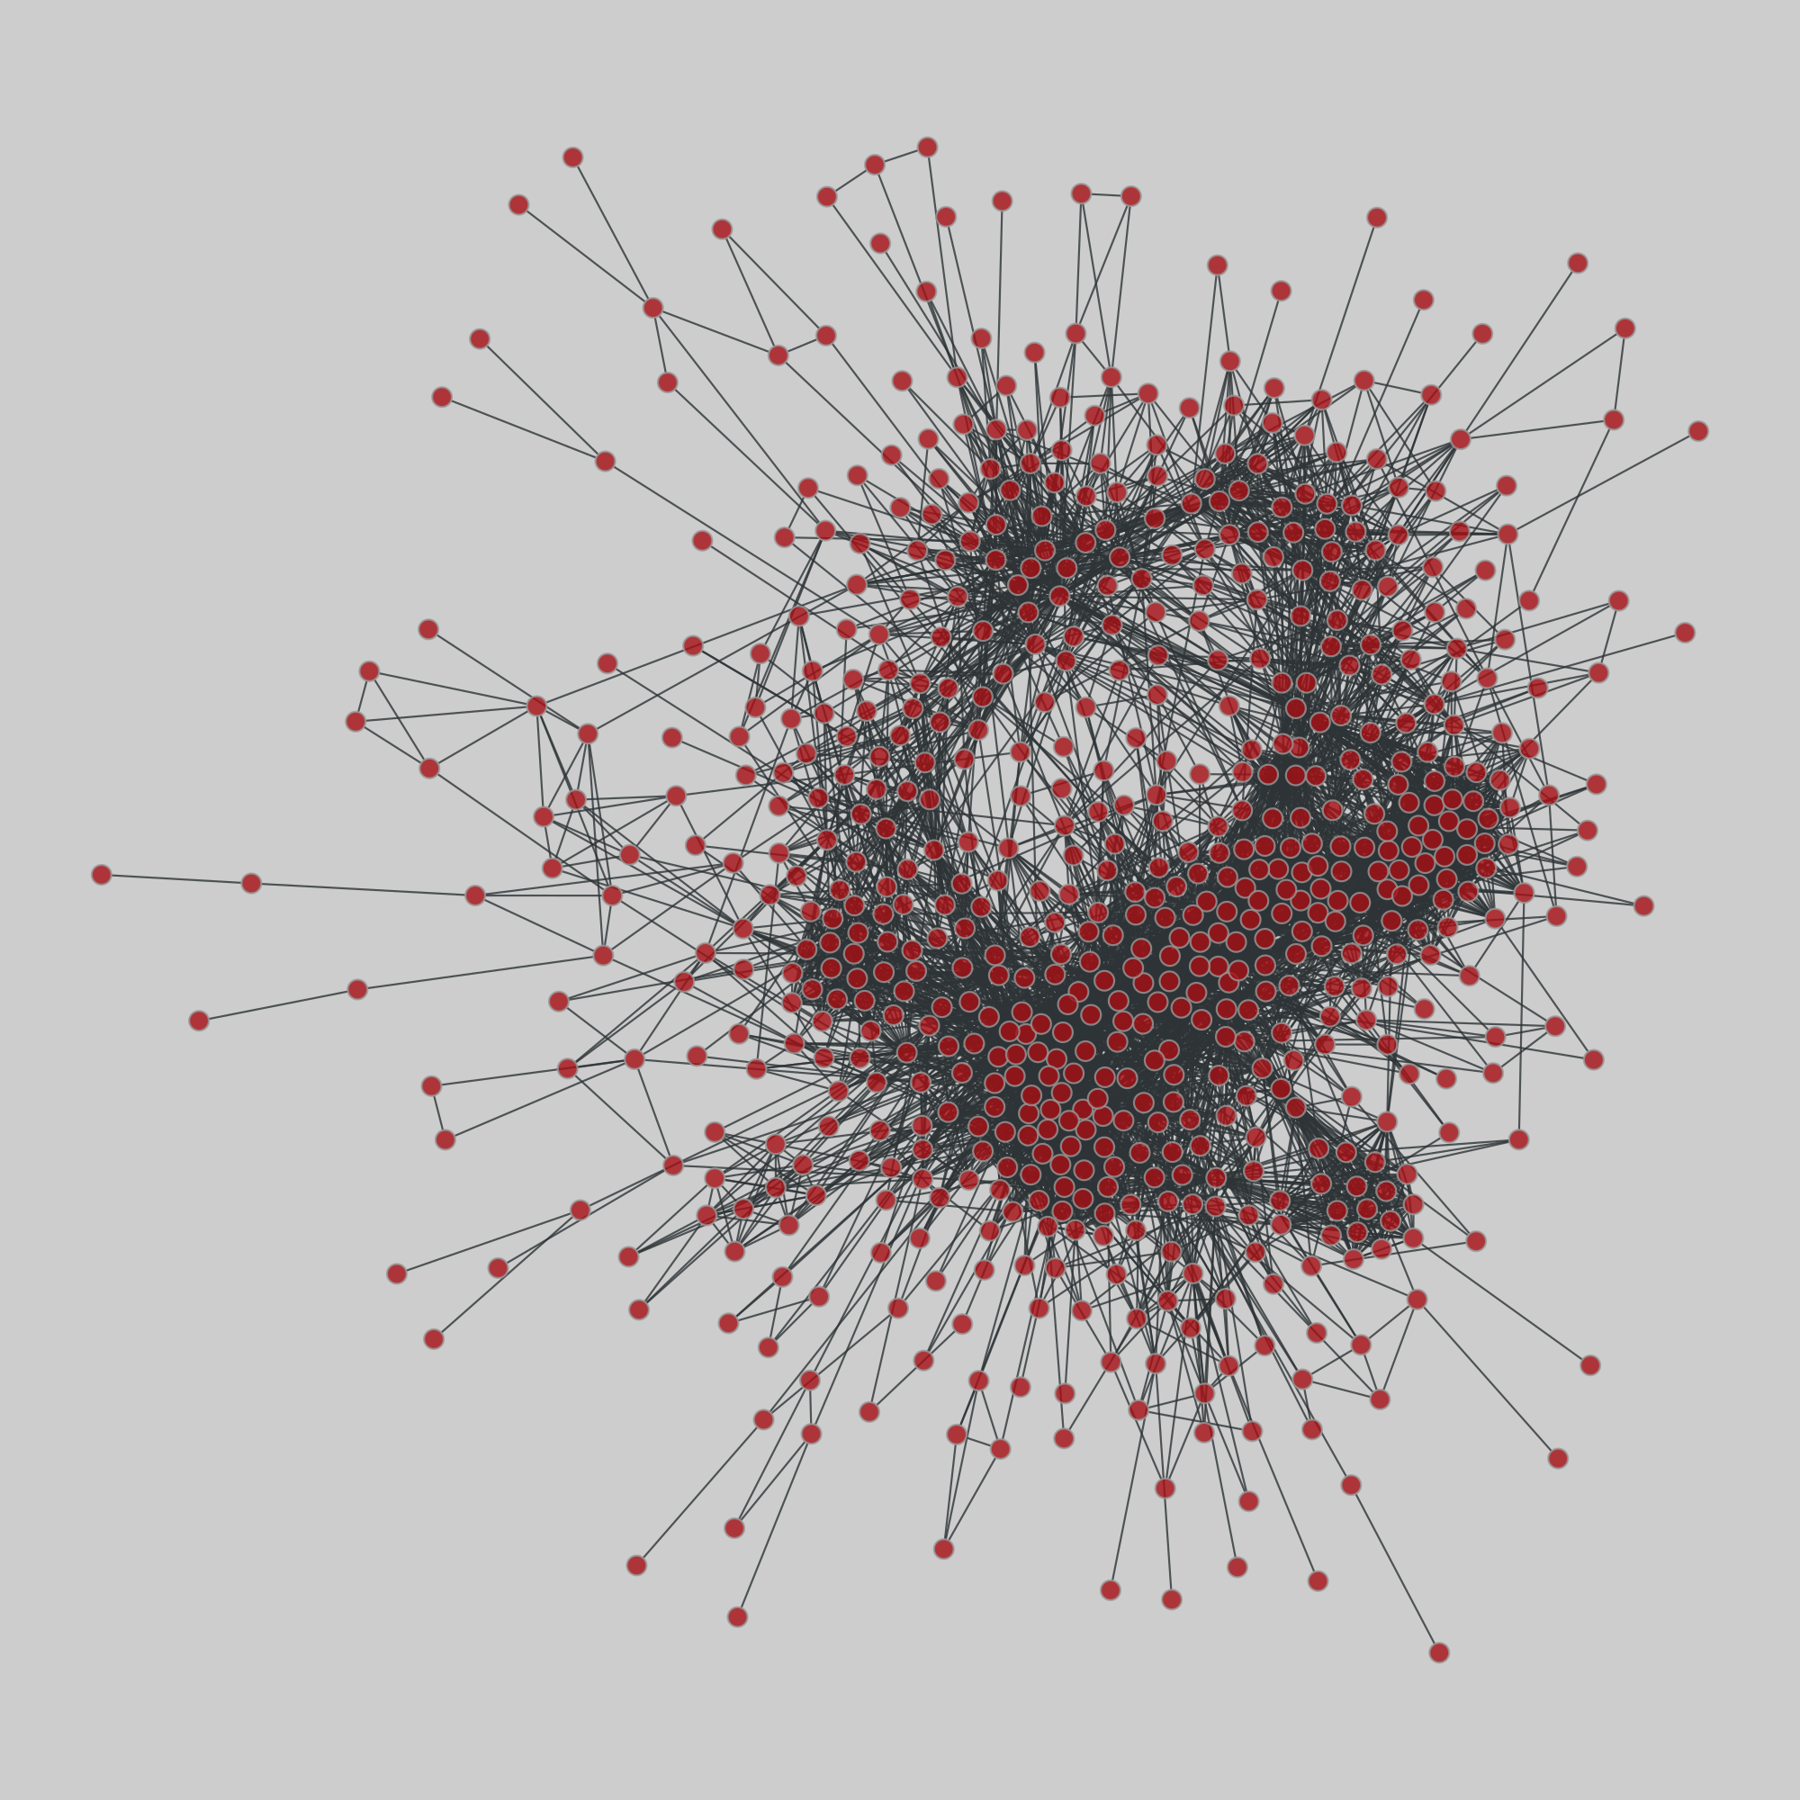
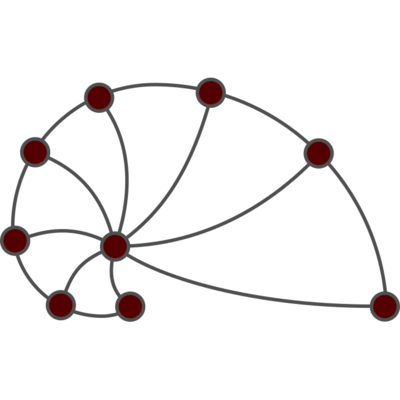
faculty_hiring_us: Faculty hiring networks in the US (2022)
Networks of faculty hiring for all PhD-granting US universities over the decade 2011–2020. Each node is a PhD-granting institution, and a directed edge (i,j) indicates that a person received their PhD from node i and was tenure-track faculty at node j during time of collection (2011-2020). This dataset is divided into separate networks for all 107 fields, as well as aggregate networks for 8 domains, and an overall network for …
 @cdarwin@c.im
The Trump administration is waging war on voting rights using justice department lawsuits,
FBI investigations,
and an executive order to limit voting by mail,
-- moves mirroring the US president’s false claims he lost the 2020 election due to voting fraud, say election experts and ex-officials.
🔥Since Donald Trump began his second term, numerous 2020 election denialists have been installed in key agencies such as the DoJ, the FBI and elsewhere to pursue widely discred…
 @fanf@mendeddrum.org
from my link log —
What made the 1960s CDC6600 supercomputer fast?
https://cpldcpu.wordpress.com/2020/02/14/what-made-the-cdc6600-fast/
saved 2020-02-15 …
 @Dragofix@veganism.social
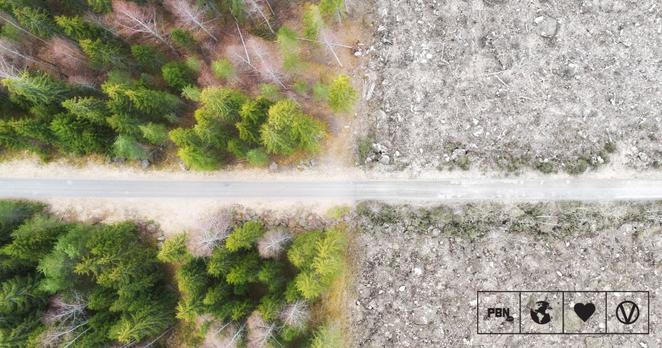
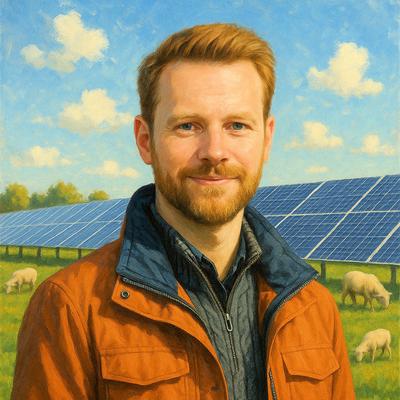
UK Government Moves To Introduce Anti-Deforestation Rules #UnitedKingdom
 @cowboys@darktundra.xyz
Cowboys Sign Former 2nd Round Pick WR Ahead of Training Camp https://heavy.com/sports/nfl/dallas-cowboys/sign-ufl-wide-receiver-denzel-mims/
 @andres4ny@social.ridetrans.it
Back in 2020 (which is when this pic is from), you could put your laptop in a plate of ketchup and it wasn't a big deal. These days, there goes your life savings.

 @seeingwithsound@mas.to
Rethinking modality-specificity in mental imagery https://link.springer.com/article/10.1007/s11229-026-05561-6 by @… on the
 @fanf@mendeddrum.org
from my link log —
Lezer: a parser system in JavaScript.
https://lezer.codemirror.net/
saved 2020-10-21 https://dotat.at/:/VL4WJ.html
 @mmuenzl@sueden.social
2020 waren wir schon mal während Corona für ein paar Tage an der Mosel.
Nun waren wir wieder mal dort.
Nach einer Woche stelle ich fest, dass die Gegend sehr camperfreundlich ist ✅ und sehr viele Stellplätze hat.
Sehr schöne Gegend zum Wandern und Radfahren ✅
Allerdings ist in einigen der bekannten Städtchen schon noch der morbide Charme der 70er spürbar 😬
Jetzt geht es weiter ins Saarland

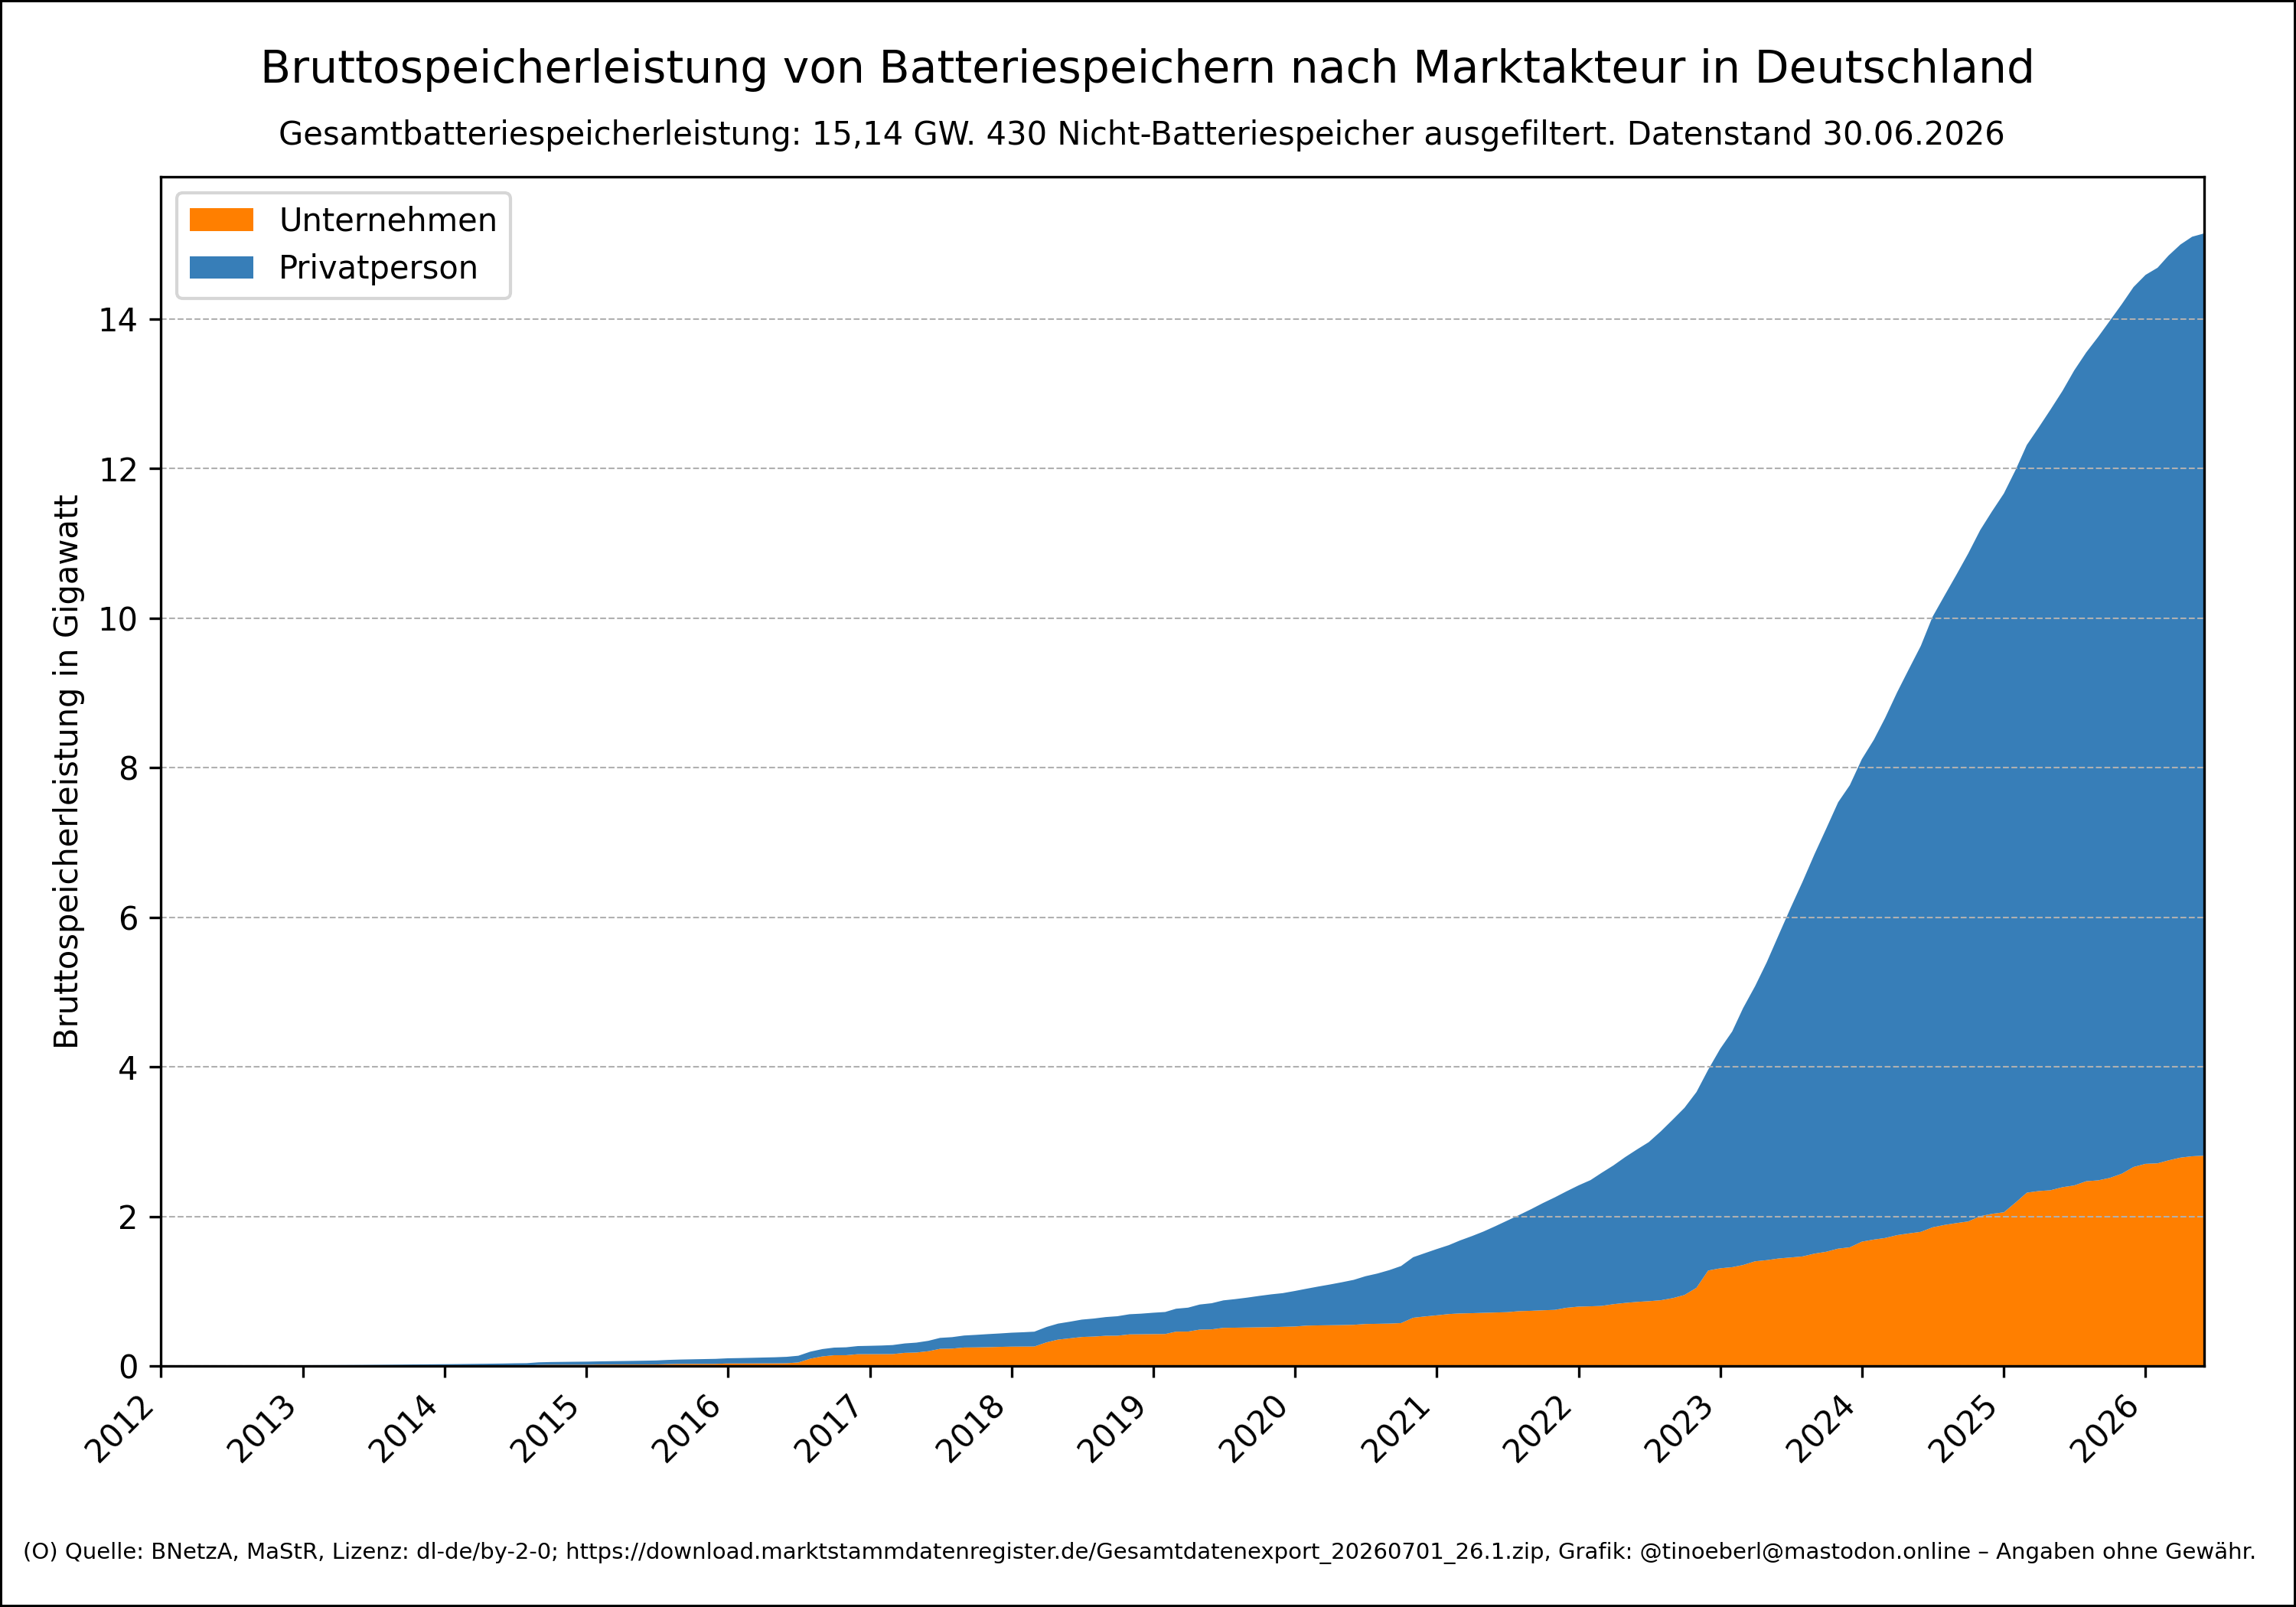
 @tinoeberl@mastodon.online
#Bruttospeicherleistung von #Batteriespeichern nach Marktakteur in #Deutschland ab 2012 mit Stand vom 30.06.2026.
Betrachtet werden Datensätze mit Betriebsstatus „akti…
 @servelan@newsie.social
Trump Administration Demands Names of 2020 Election Workers in Georgia - The New York Times
https://www.nytimes.com/2026/05/04/us/politics/trump-2020-georgia-election-workers.html
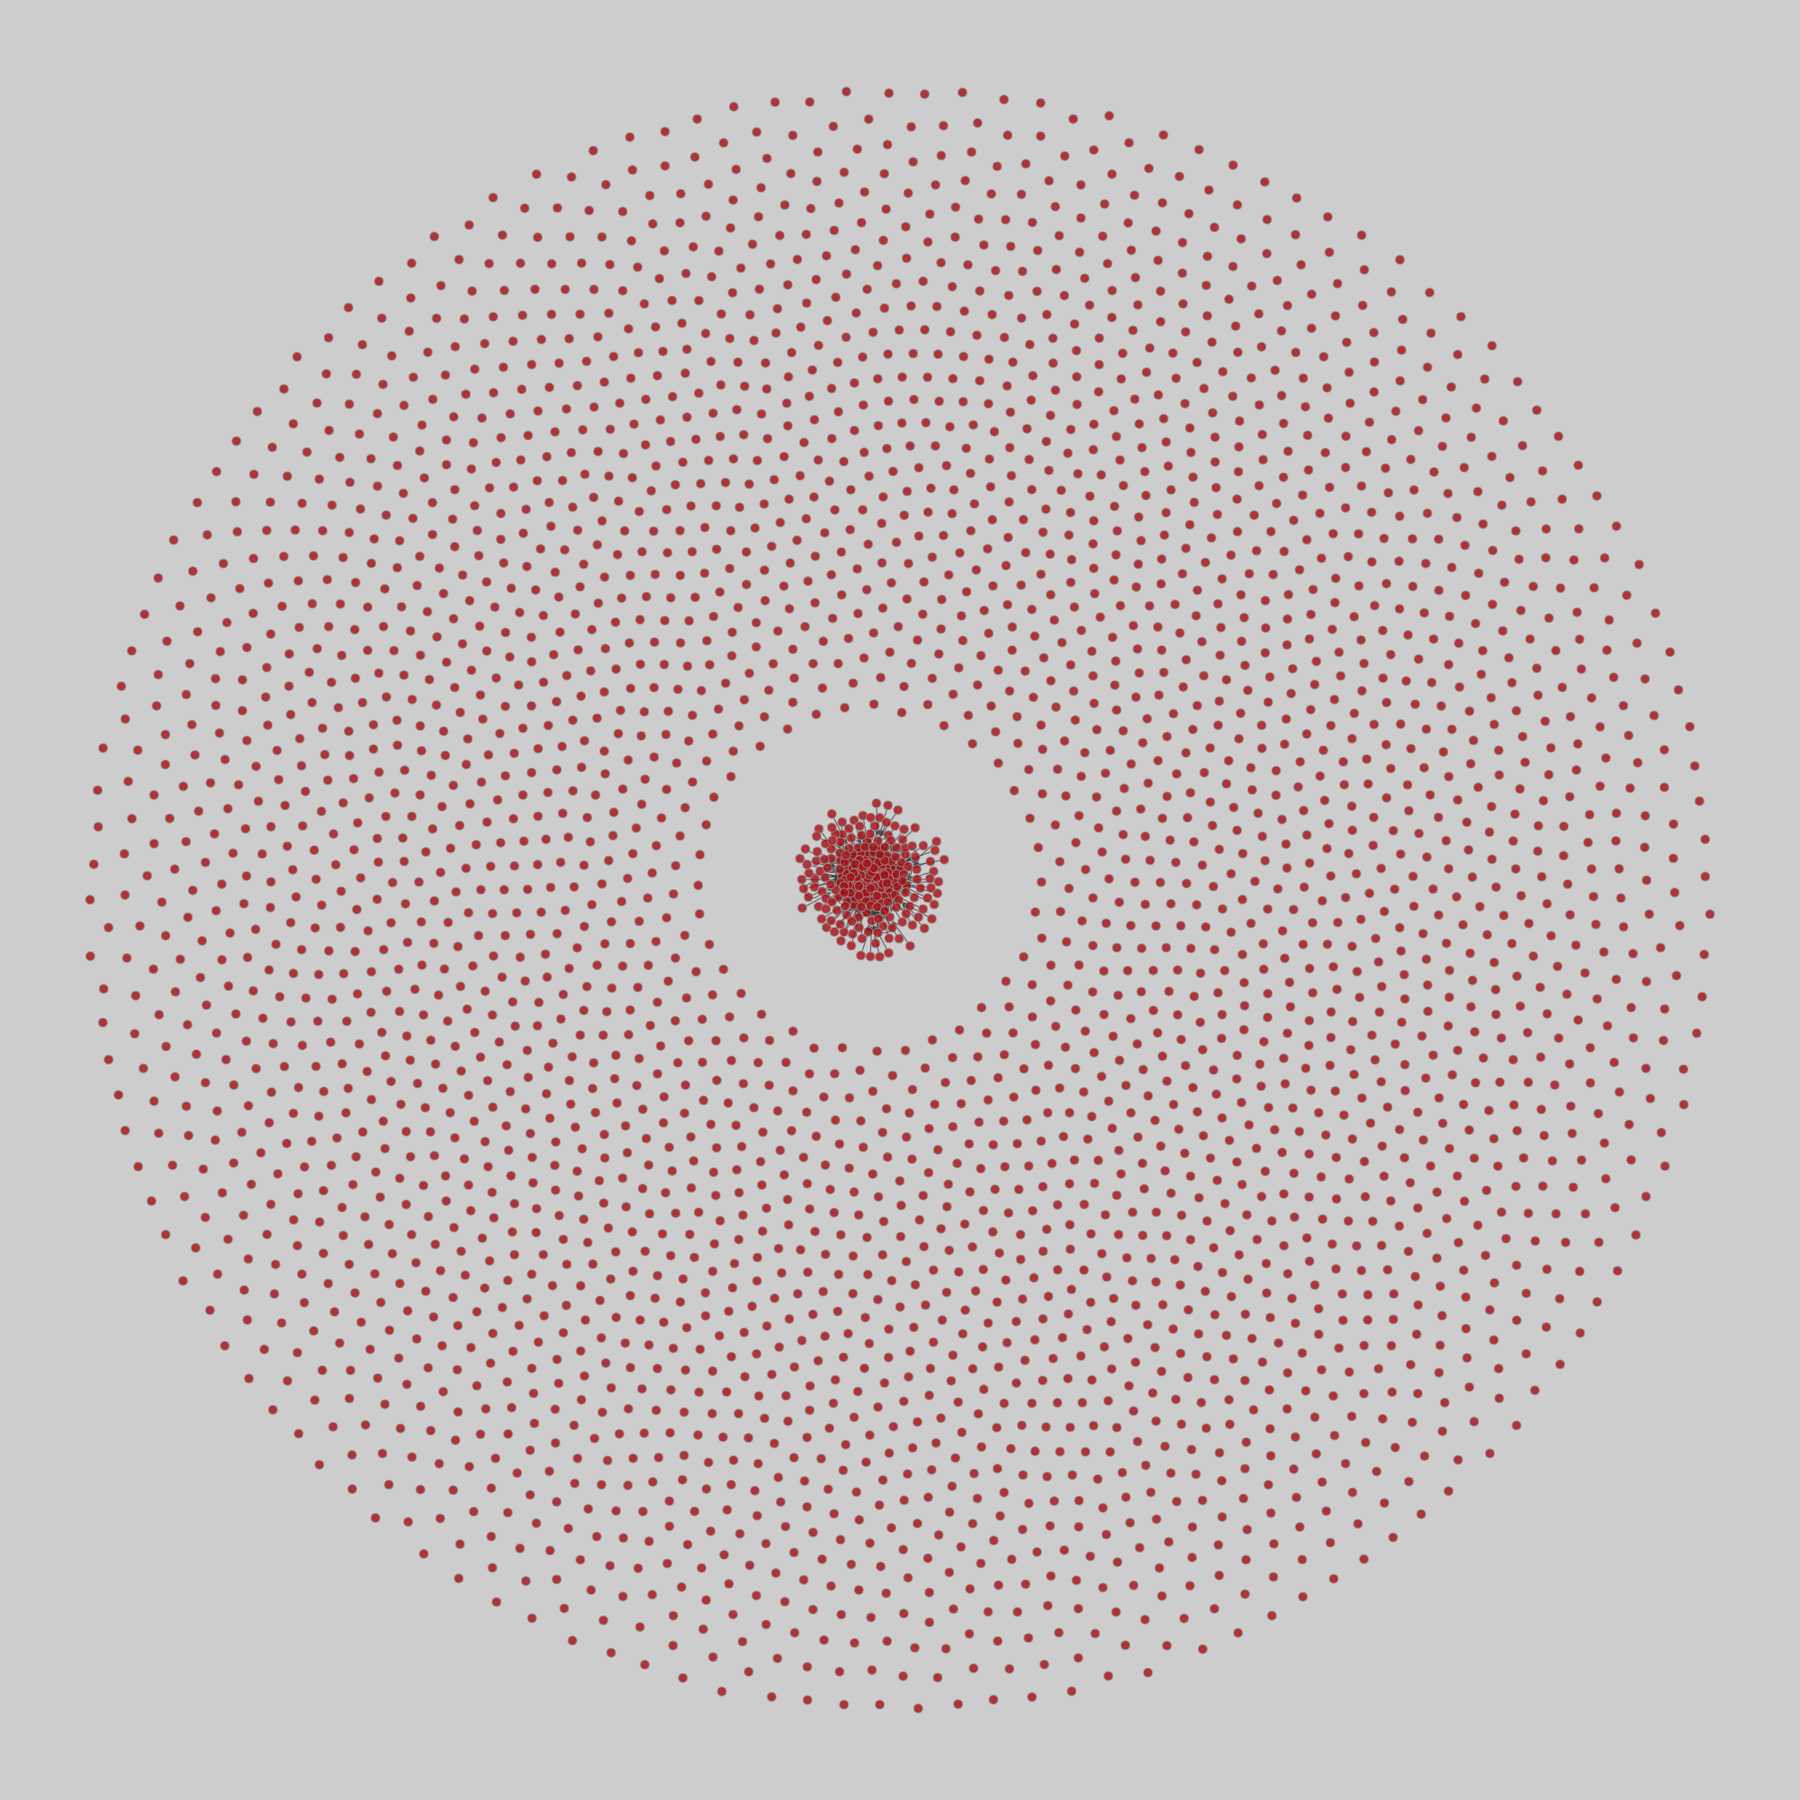
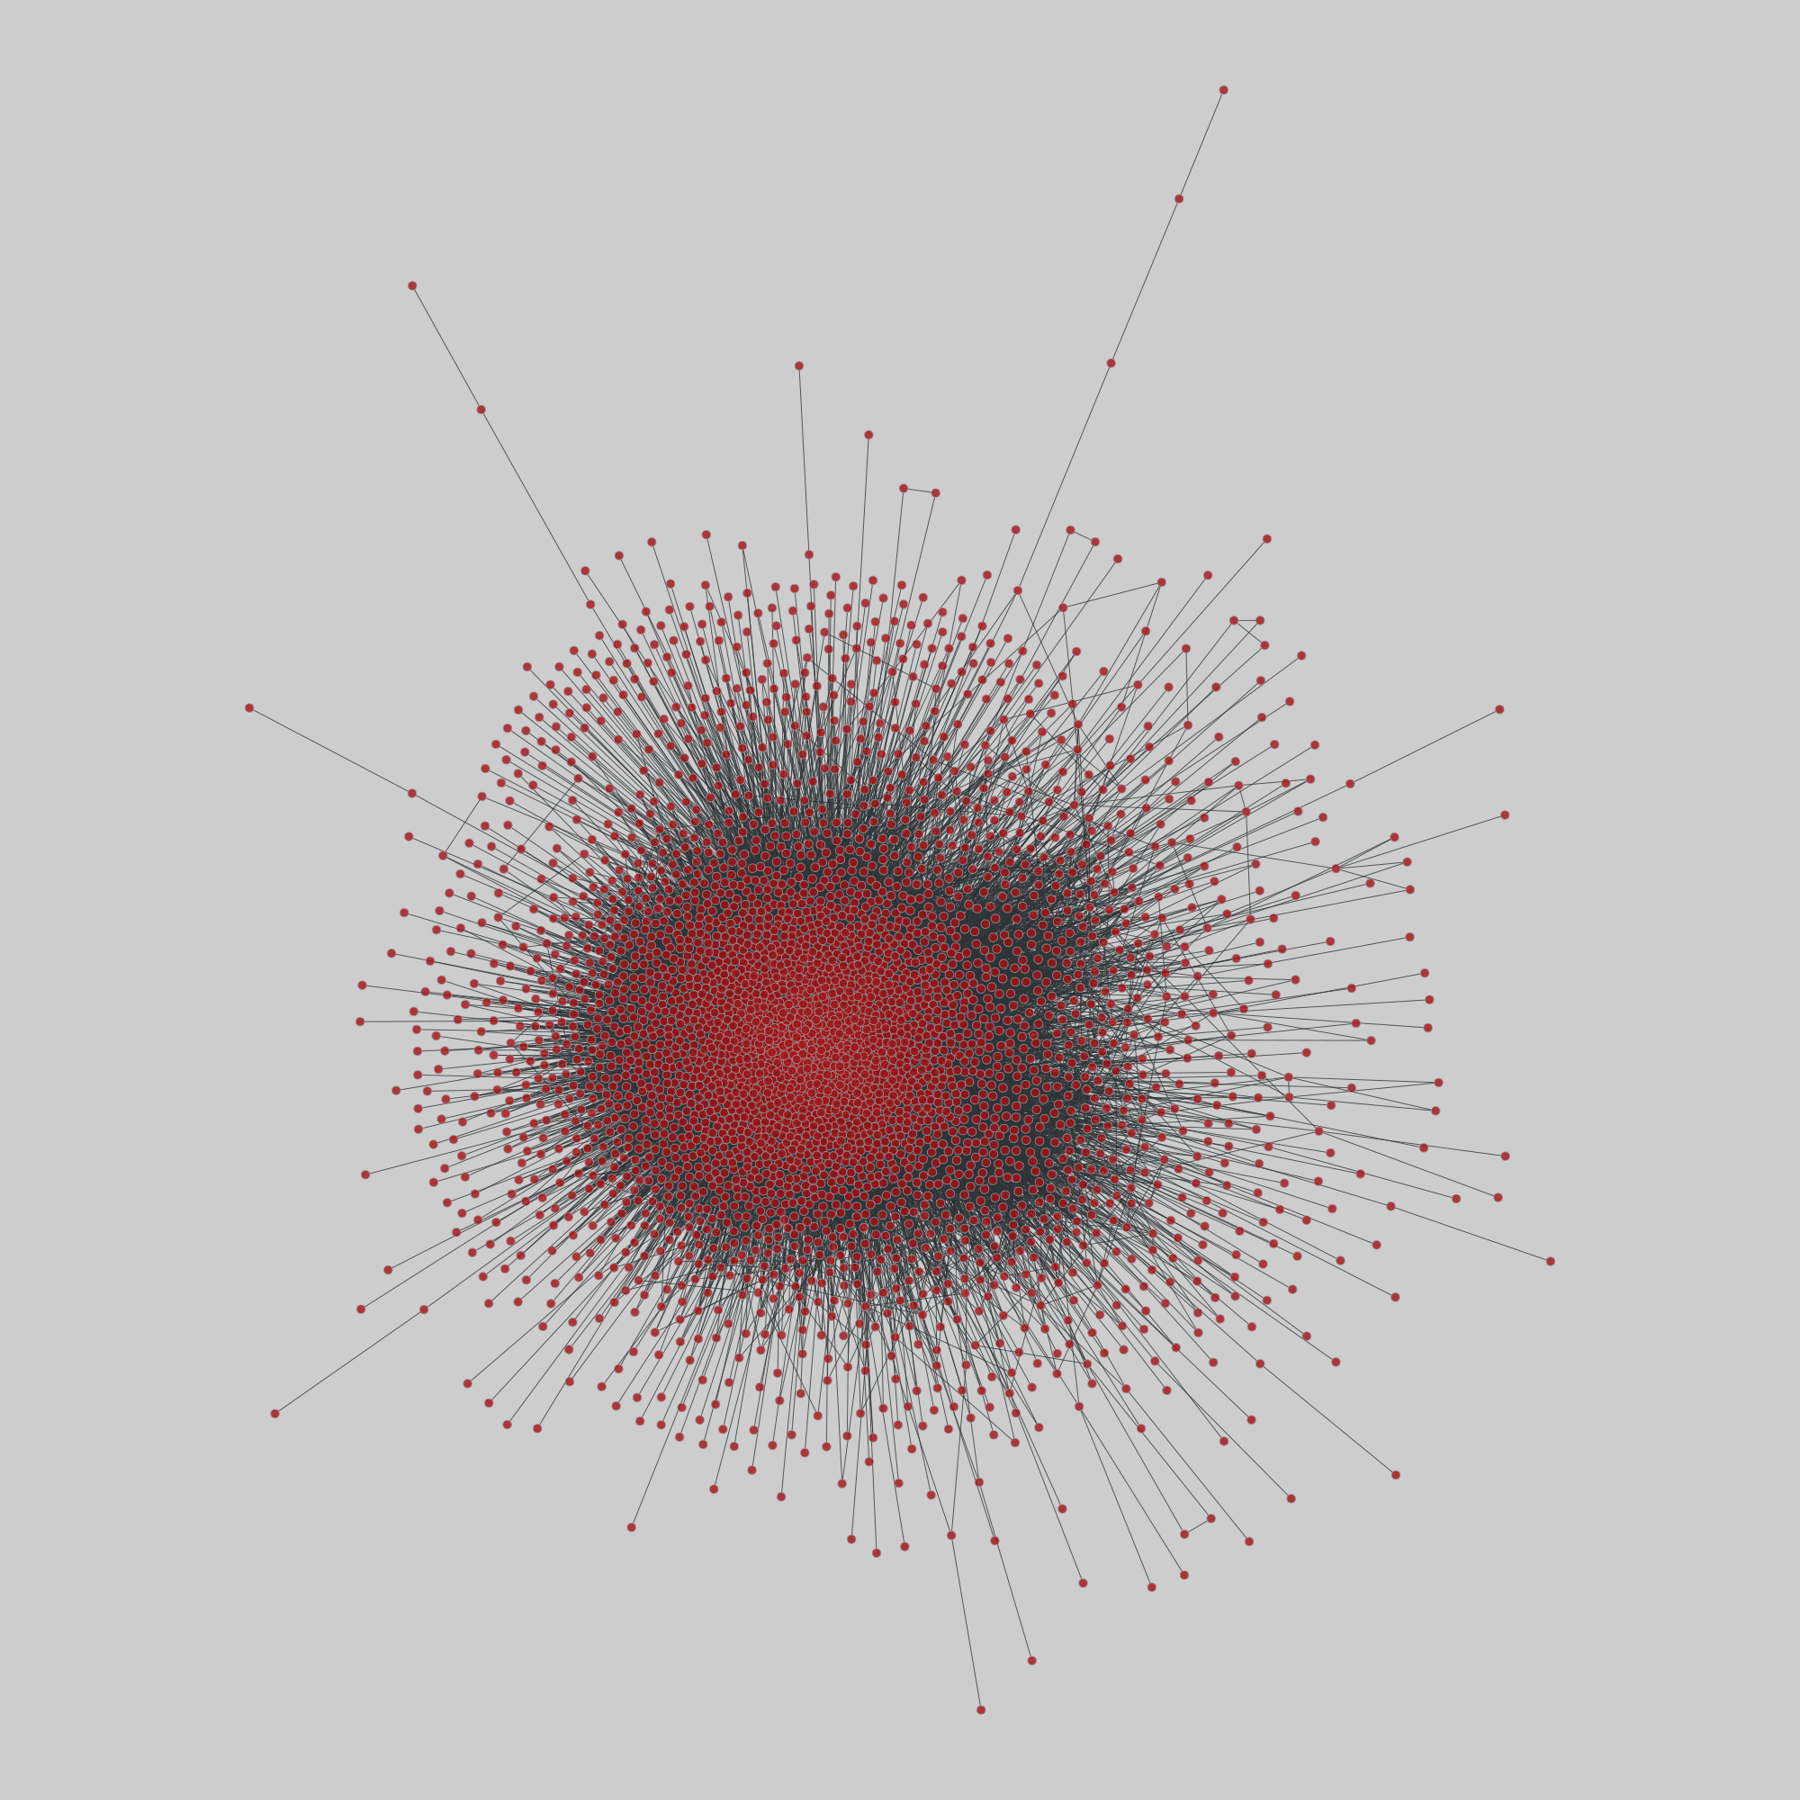
@netzschleuder@social.skewed.demist: MIST protein interaction database (2020)
The Molecular Interaction Search Tool (MIST) is a comprehensive resource of molecular interactions, assembled from severla primary sources. MIST currently supports several species, including:.
This network has 3563 nodes and 52013 edges.
Tags: Biological, Protein interactions, Unweighted
 @jake4480@c.im
Late #ThursDeath this week, it's still Thursday here for a bit. This week is this unreal new DESECRESY record, 'The Secret of Death'. Supposed to be out today, now, should definitely be up by tomorrow, the 22nd, etc. But these 2 singles are great, and I heard the rest, it is too.
 @Techmeme@techhub.social
An analysis of 600 Elon Musk claims over 15 years finds he met deadlines 19% of the time; he achieved 75% of his 2015 goals on time, but under 50% of 2020 ones (New York Times)
https://www.nytimes.com/interactive/2026/0
 @memeorandum@universeodon.com
All the Dictator's Men -- The assault on liberal democracy is a whole-of-government Trumpist project. (The Bulwark)
https://www.thebulwark.com/p/all-the-dictators-men-trump-blanche-clayton-democracy-midterms-elections-2020
http://www.memeorandum.com/260716/p49#a260716p49
 @Dragofix@mastodontti.fi
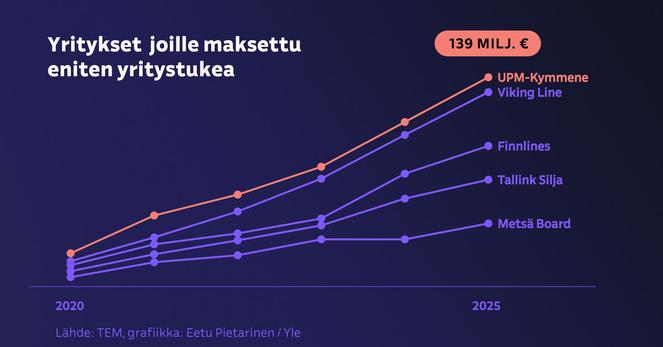
Vanha metsäjätti on saanut jättimäärän yritystukia viime vuosina – tutkija: Näin ylläpidetään vanhaa #politiikka
@fanf@mendeddrum.orgfrom my link log —
Tips for PostgreSQL bulk data loading.
https://www.2ndquadrant.com/en/blog/7-best-practice-tips-for-postgresql-bulk-data-loading/
saved 2020-09-16
 @presseportal_pol_NDS@frawas.de
POL-GÖ: (109/2026) Heinrich S. aus Bad Lauterberg seit Montagnachmittag vermisst - Polizei Bad Lauterberg bittet um Mithilfe Göttingen (ots) - Bad Lauterberg, Montag, 20. April 2020, gegen 16:30 Uhr BAD LAUTERBERG (ab) - Seit Montagnachmittag (20.04.26) wird Heinrich S. aus Bad Lauterberg (Landkreis Göttingen) vermisst. Nach derzeit vorliegenden Informationen verließ ...
@fanf@mendeddrum.orgfrom my link log —
Systems Performance: Enterprise and the Cloud, 2nd Edition.
http://www.brendangregg.com/blog/2020-07-15/systems-performance-2nd-edition.html
saved 2020-07-16
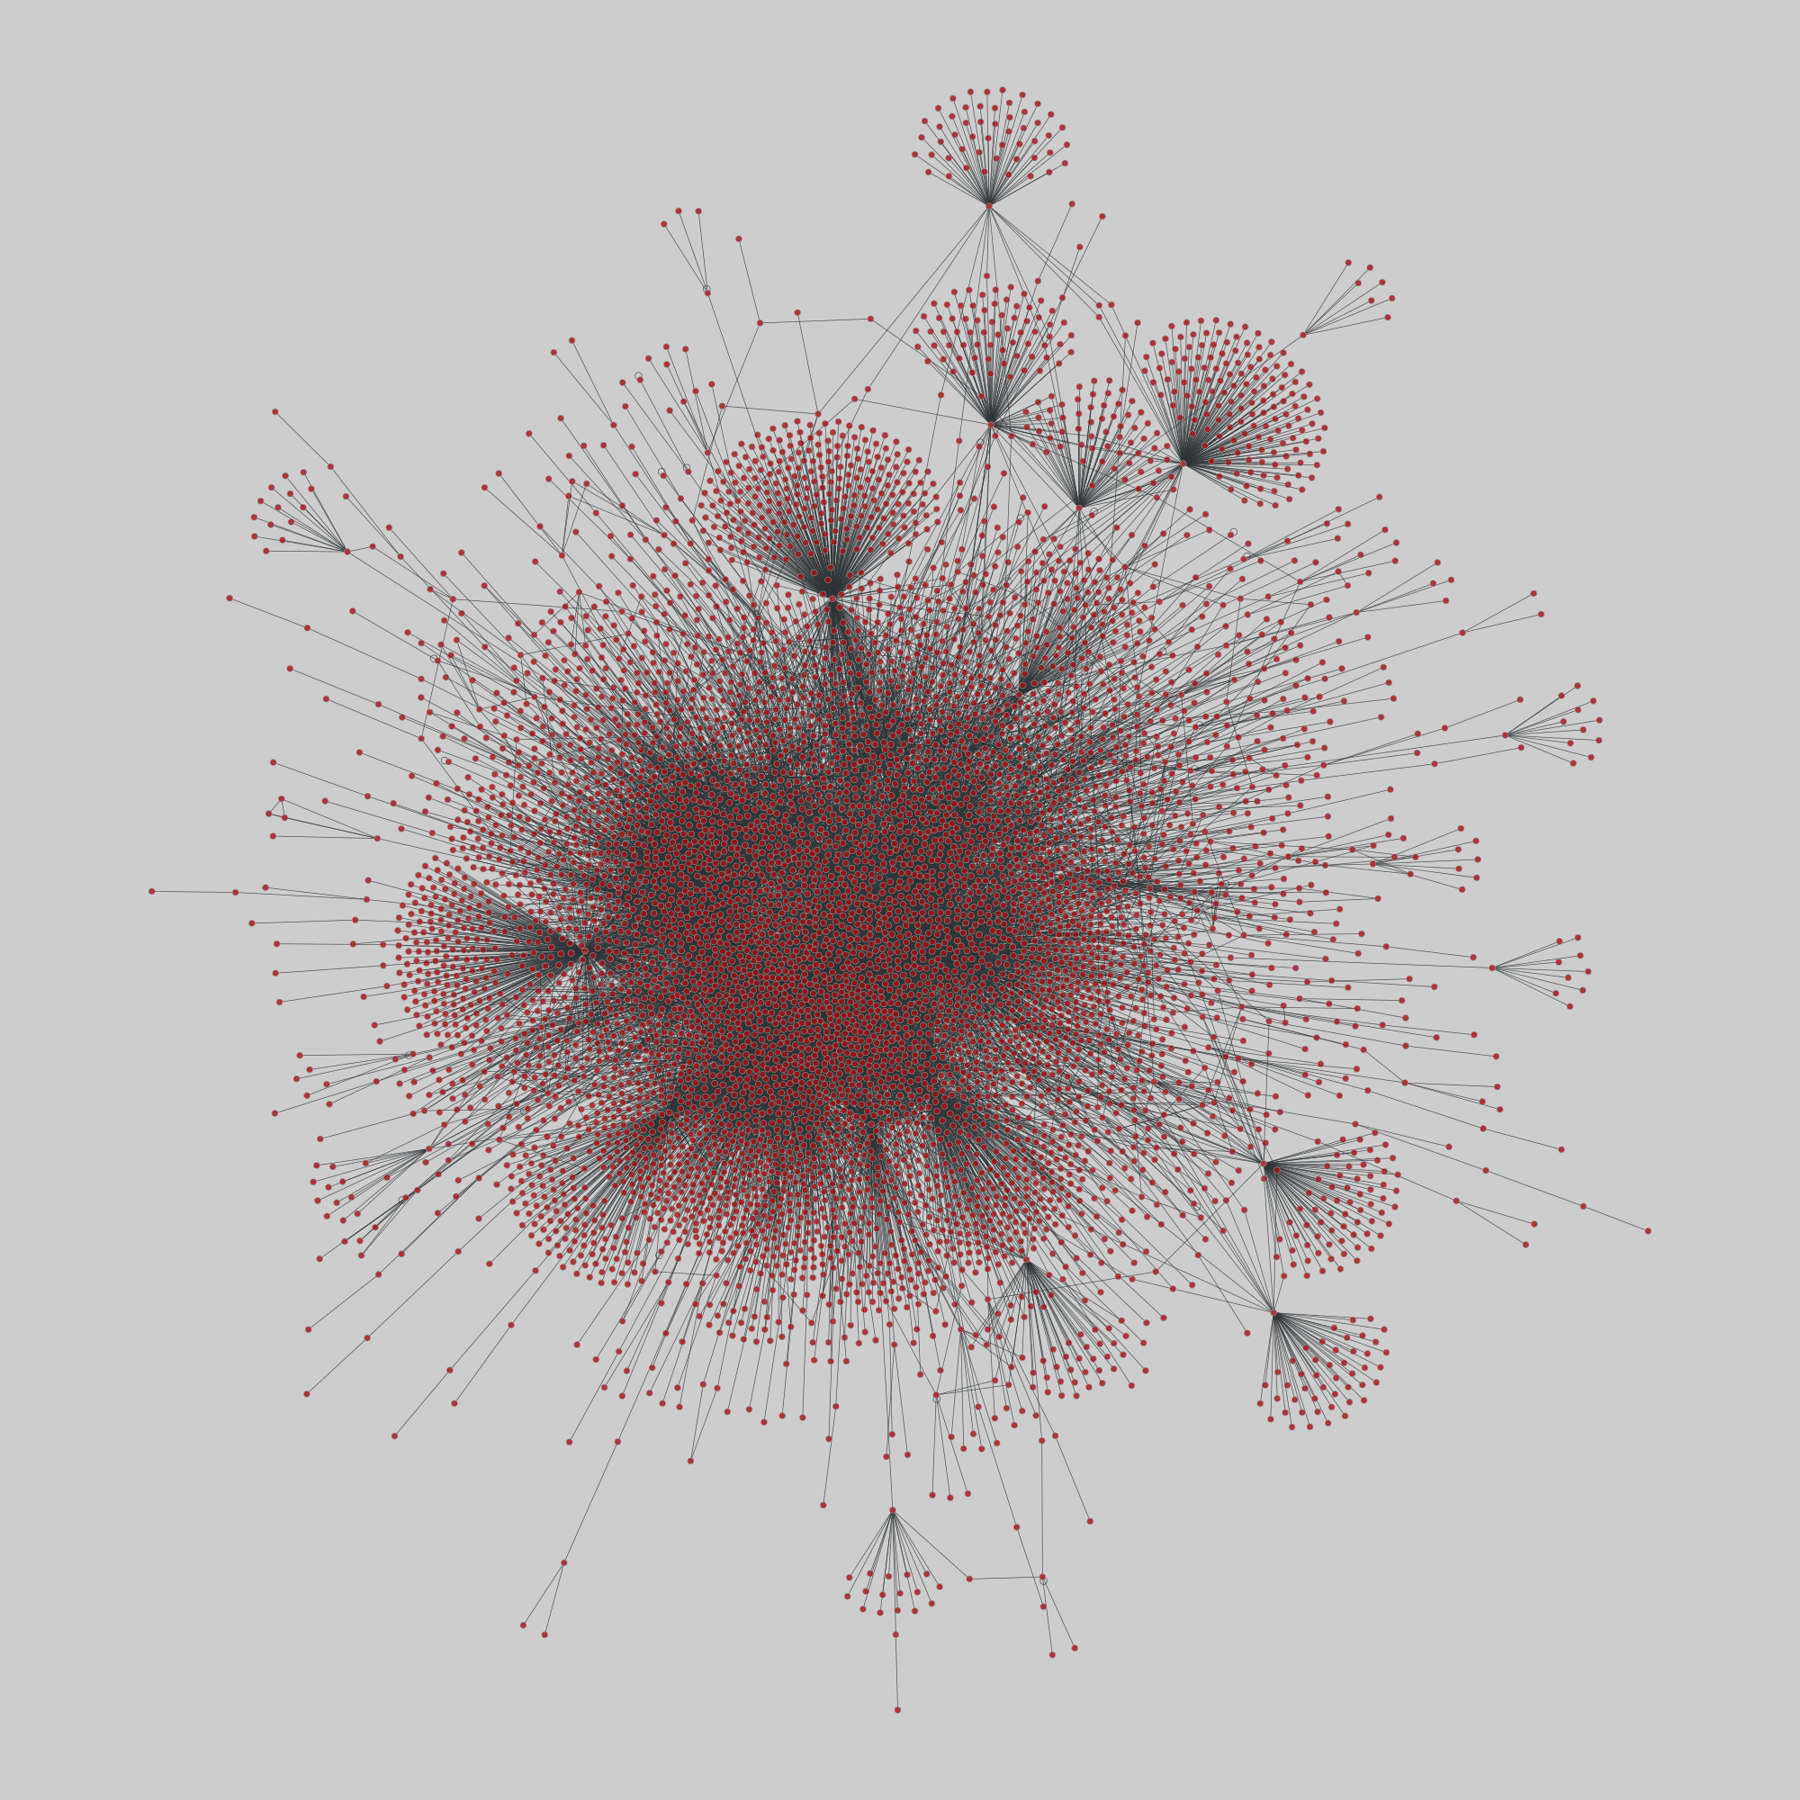
@netzschleuder@social.skewed.demist: MIST protein interaction database (2020)
The Molecular Interaction Search Tool (MIST) is a comprehensive resource of molecular interactions, assembled from severla primary sources. MIST currently supports several species, including:.
This network has 7050 nodes and 14969 edges.
Tags: Biological, Protein interactions, Unweighted
htt…
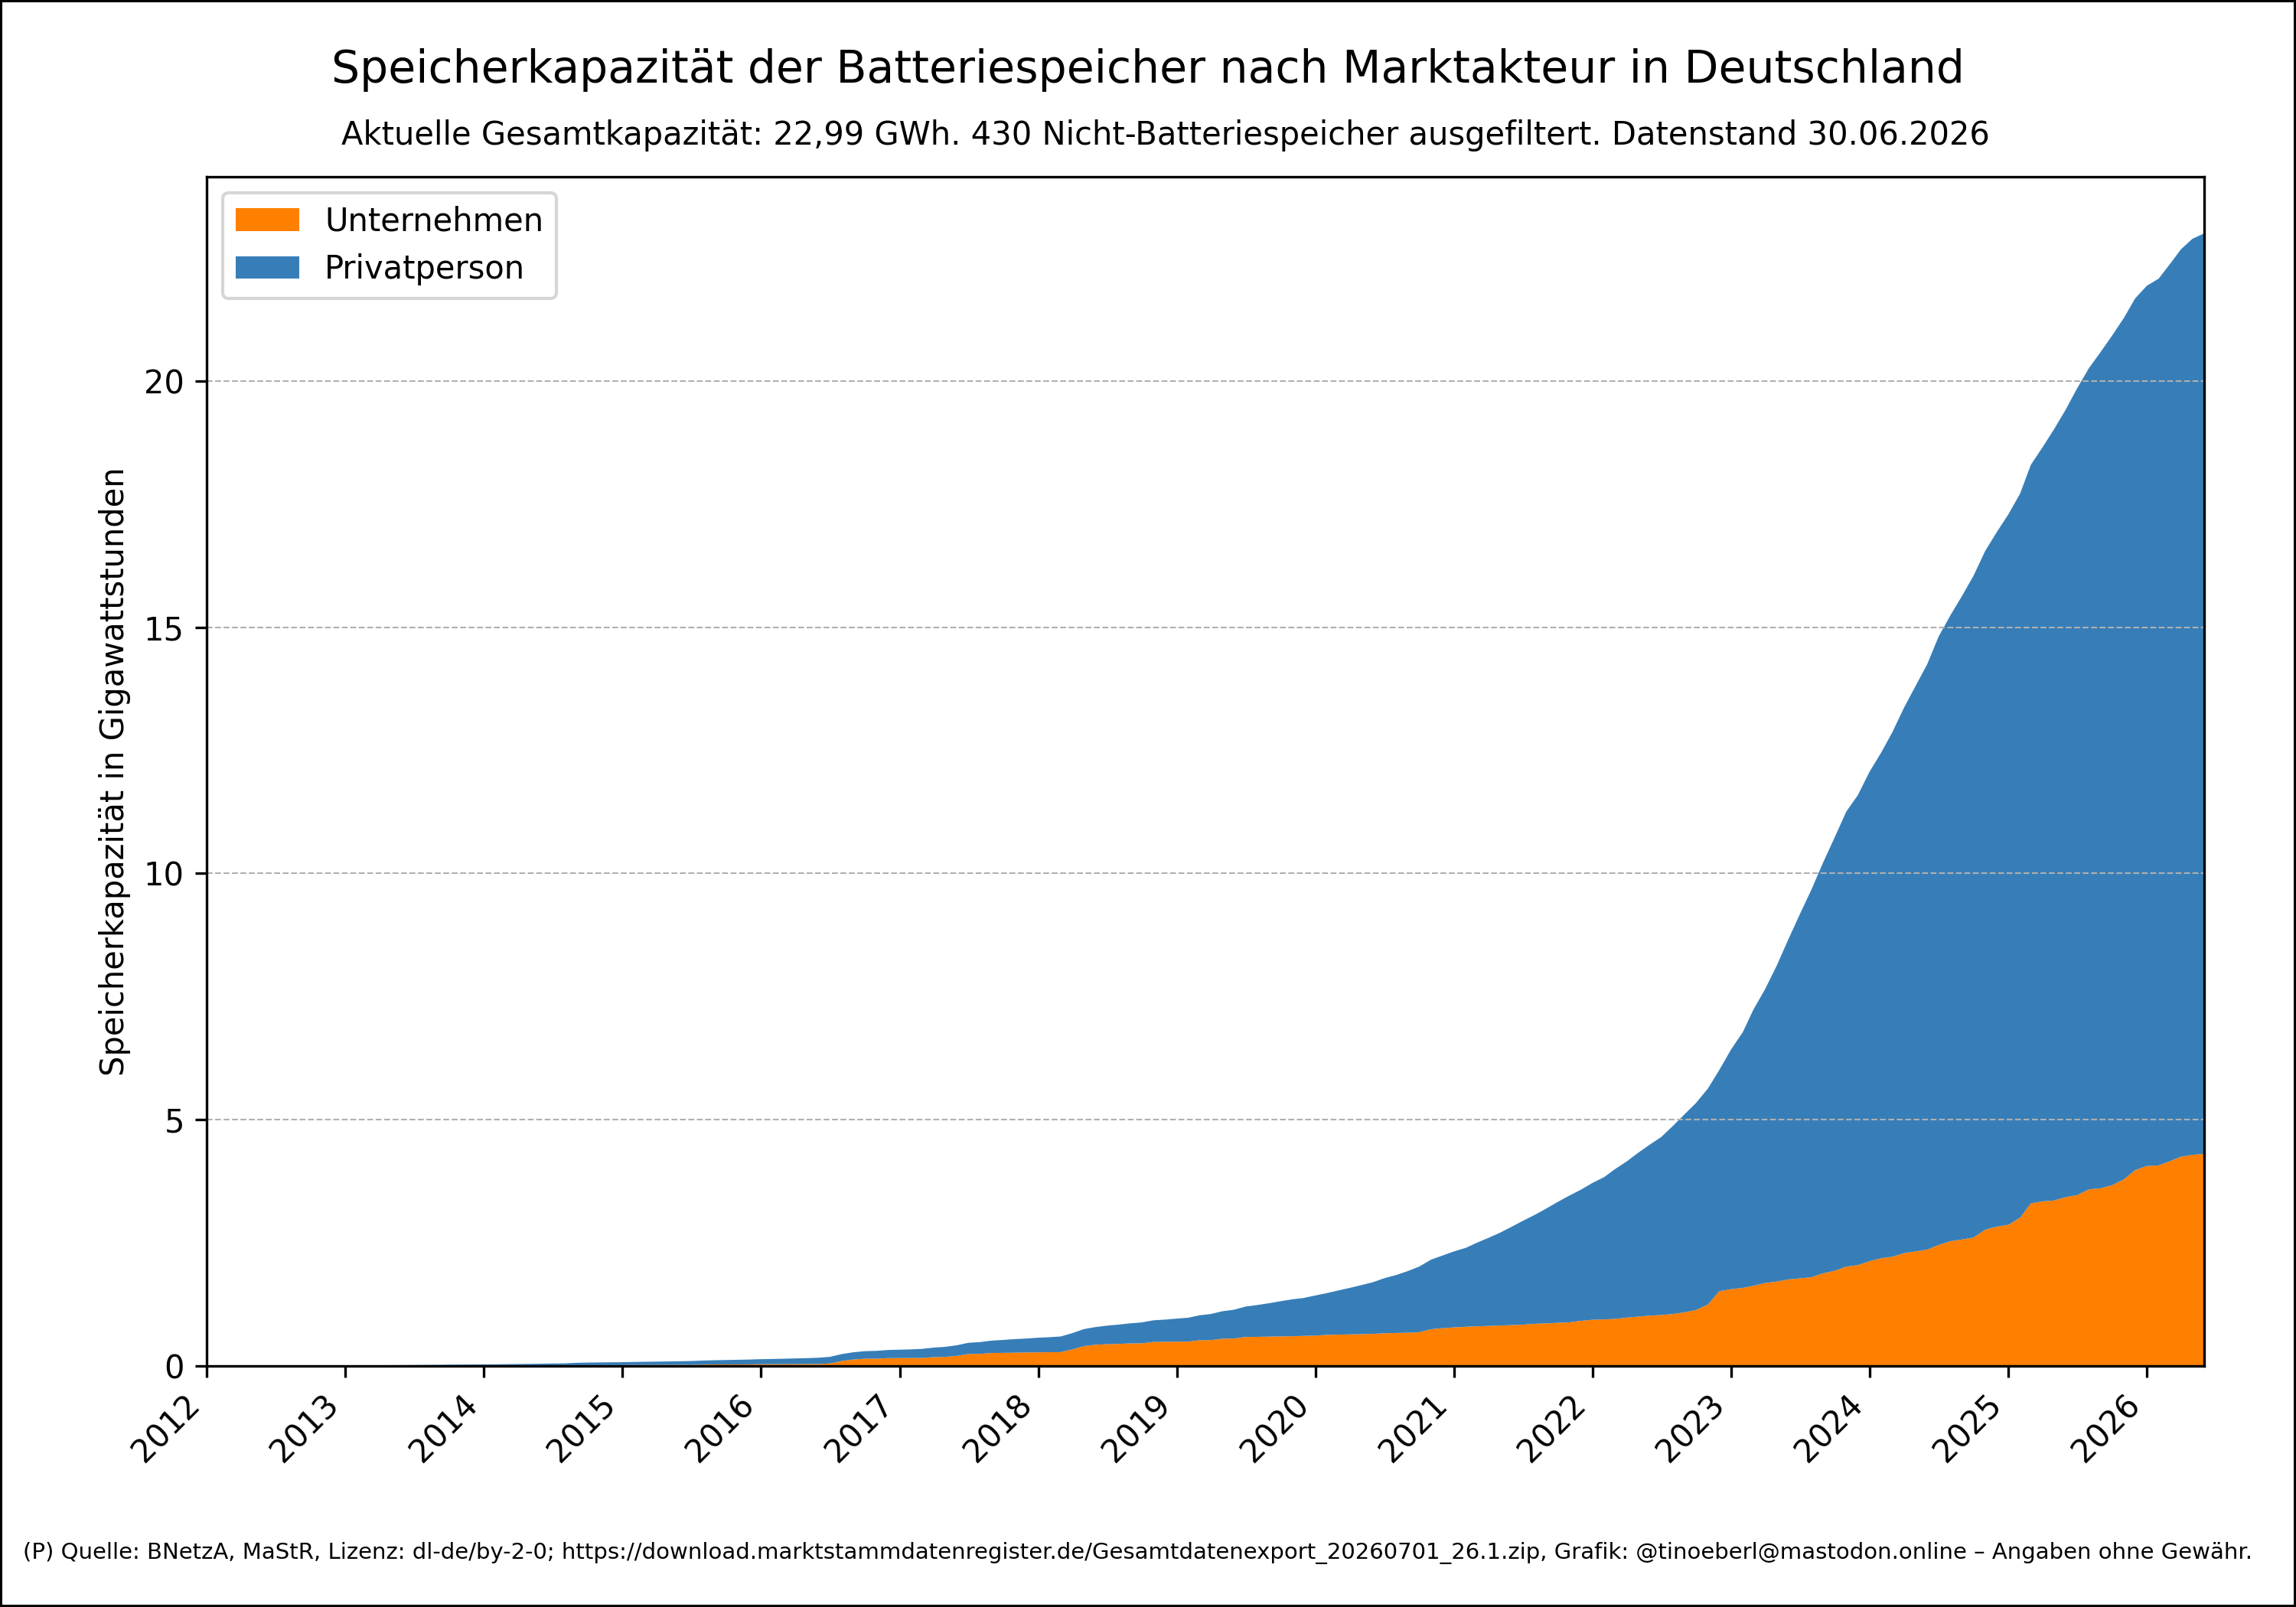
 @tinoeberl@mastodon.online
#Speicherkapazität der #Batteriespeicher nach #Marktakteur in #Deutschland
 @netzschleuder@social.skewed.de
wiki_science: Wikipedia Map of Science (2020)
A network of scientific fields, extracted from the English Wikipedia in early 2020. Nodes are wikipedia pages representing natural, formal, social and applied sciences, and two nodes are linked if the cosine similarity of the page content is above a threshold. See <http://www.s…