Tootfinder

Opt-in global Mastodon full text search. Join the index!

The most revealing fact about Google’s water use in The Dalles is not just the size of the number.
It is how difficult that number was for the public to obtain.
The Dalles spent 13 months fighting to keep Google’s water use secret
— then records showed the data center campus consumed roughly a third of the Oregon city’s supply

My mother brought me to this country from Peru as a young boy.
She always told me that we need to work hard, give back, and help our community,
because that is what it means to be an American. 


When she died of COVID-19,
I promised I would fight like hell for every family like ours.
In 2022 my community sent me to Congress - the first openly LGBTQ immigrant ever elected - to do just that. 

I’m Robert Garcia – now the top Democrat on the House Ov…

@daniel@social.telemetrydeck.com
2026-05-28 21:22:39

Girls just wanna have Pfand

@tinoeberl@mastodon.online
2026-07-01 06:17:02

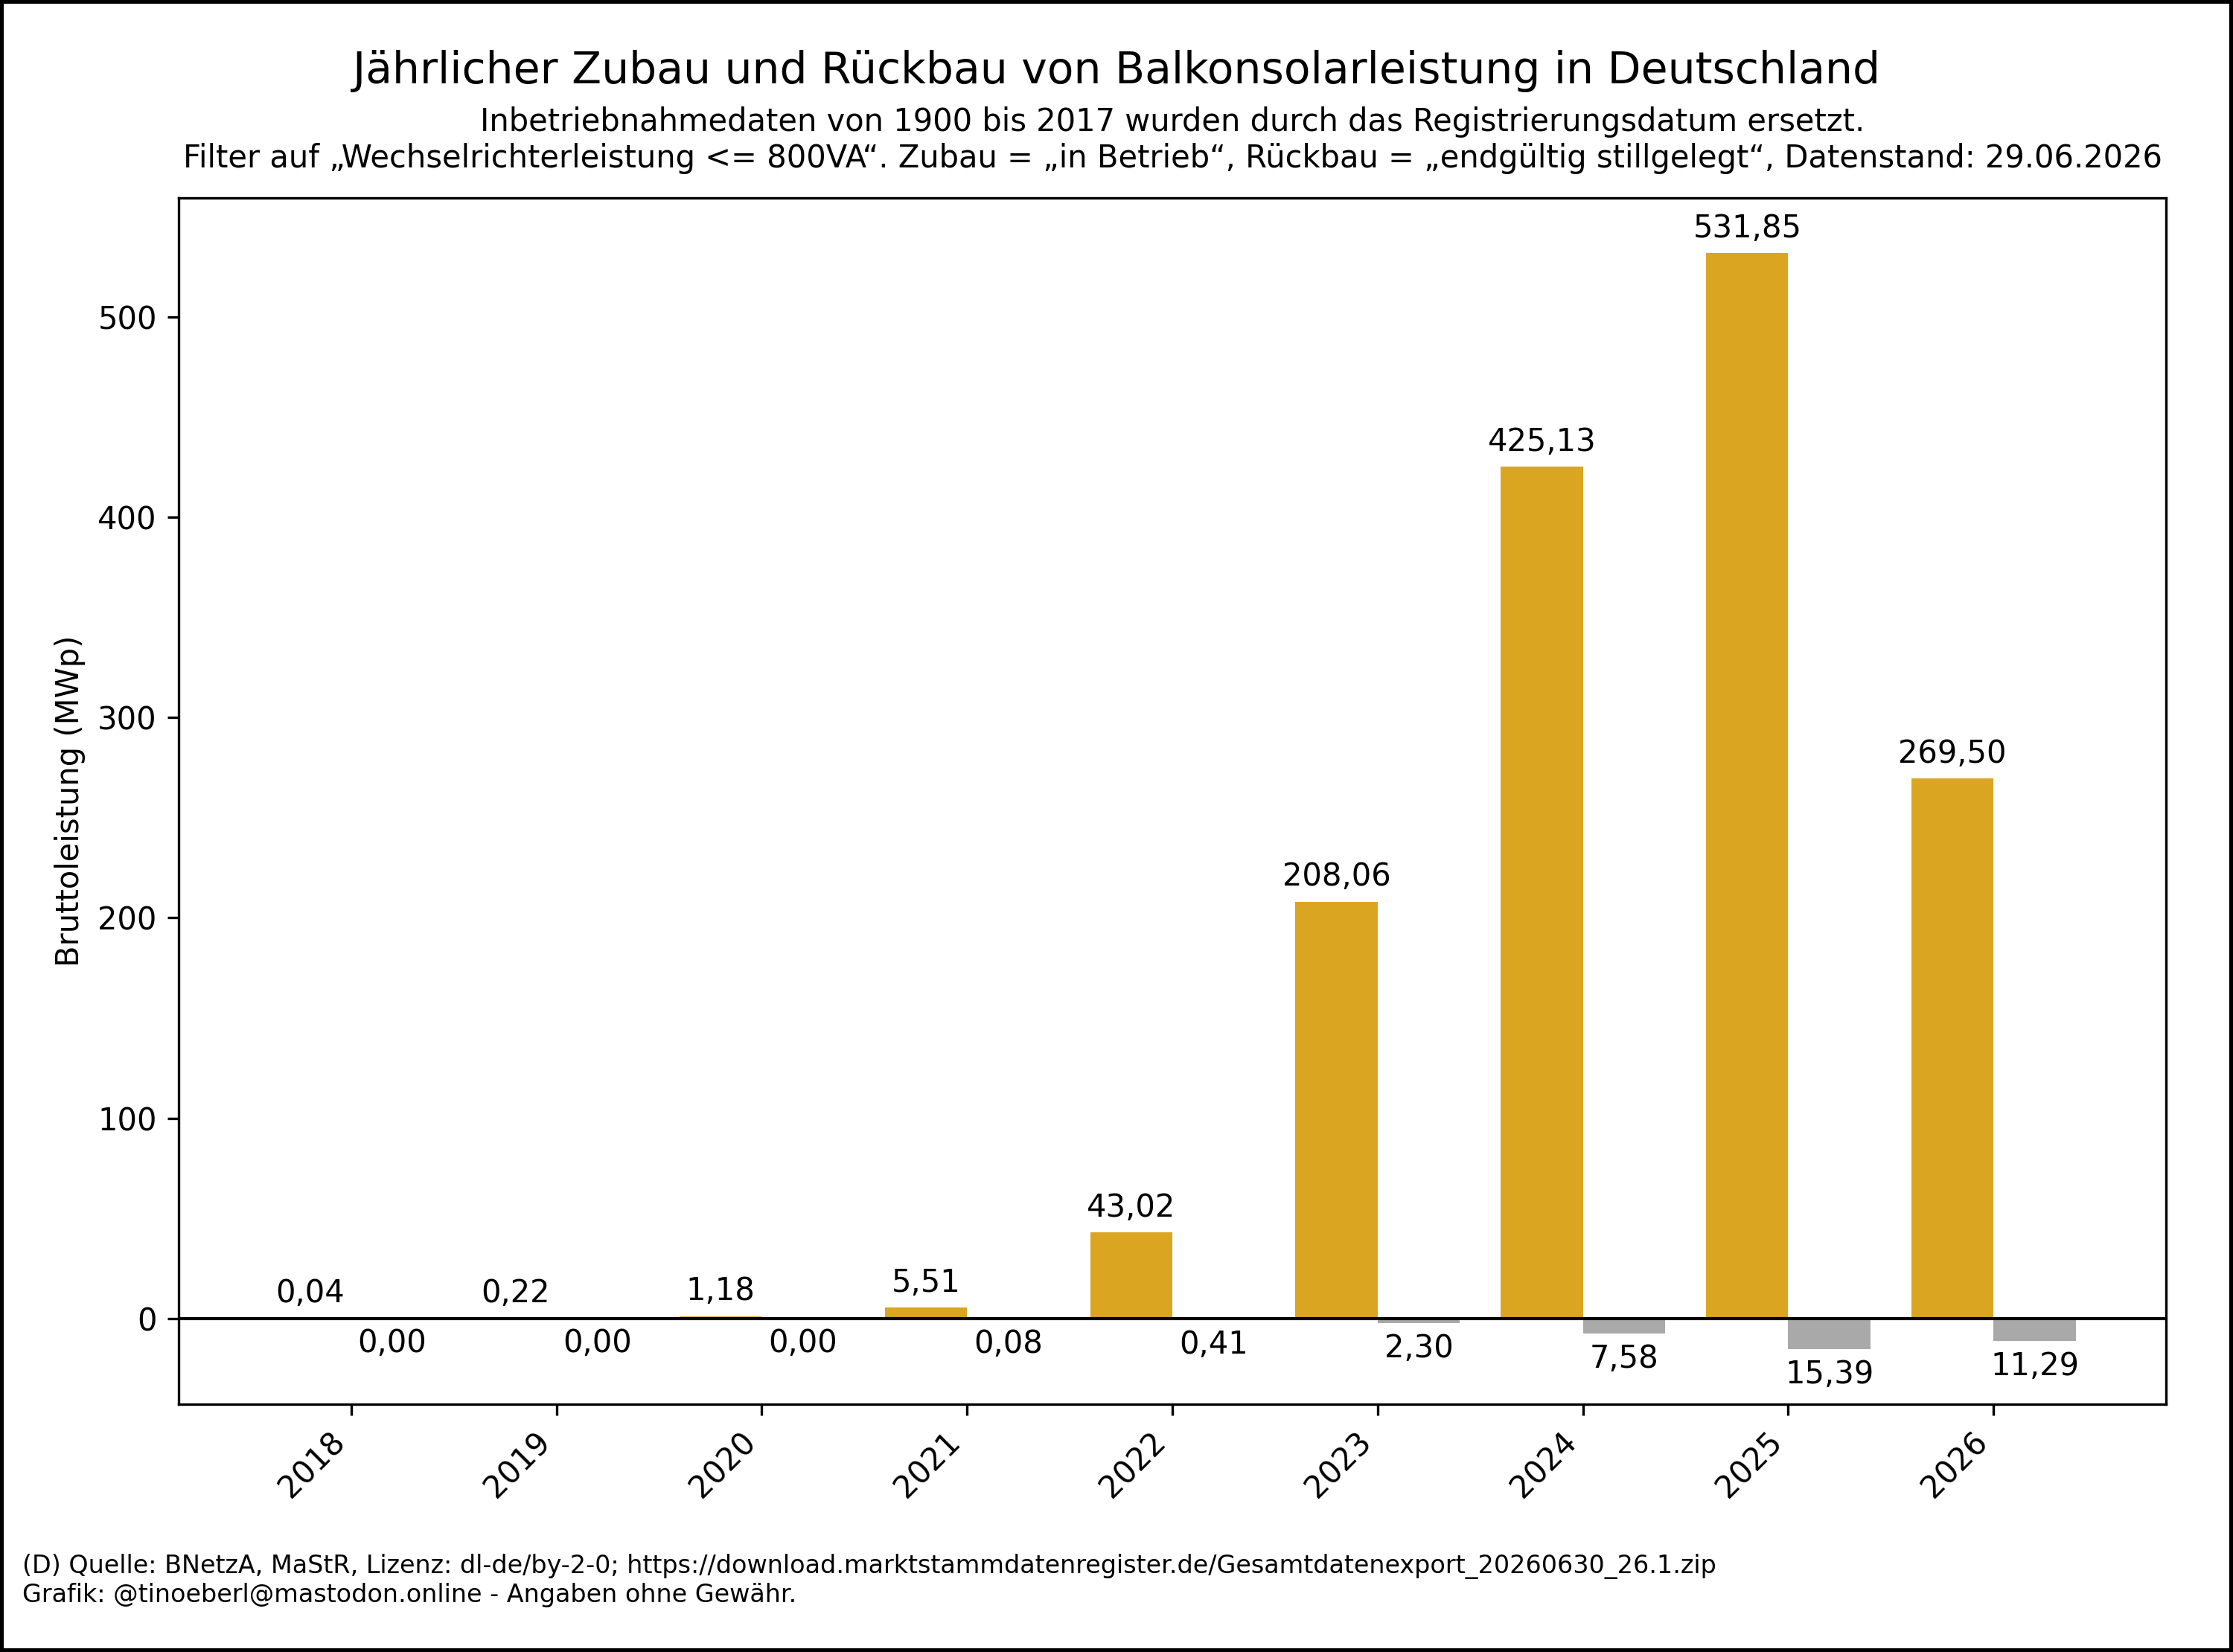
Jährlicher Zubau und Rückbau von #Balkonsolarleistung in Deutschland mit Stand vom 29.06.2026.
Unplausible Inbetriebnahmedaten von 1900 bis 2017 wurden durch das Registrierungsdatum der #Steckersolaranlage ersetzt.
👉 Zusatzlesestoff:

Balkendiagramm zum jährlichen Zubau und Rückbau von #Balkonsolarleistung in Deutschland von 2018 bis 29.06.2026. Die Werte pro Jahr in Megawatt lauten: 2018: 0,04, 2019: 0,22, 2020: 1,18, 2021: 5,51, 2022: 43,02, 2023: 208,06, 2024: 425,13, 2025: 531,85, 2026: 269,50.
@daniel@social.telemetrydeck.com
2026-05-22 07:29:09

Good morning gang! Let’s solve the mystery of the missing funnel steps!

@tinoeberl@mastodon.online
2026-07-01 16:27:02

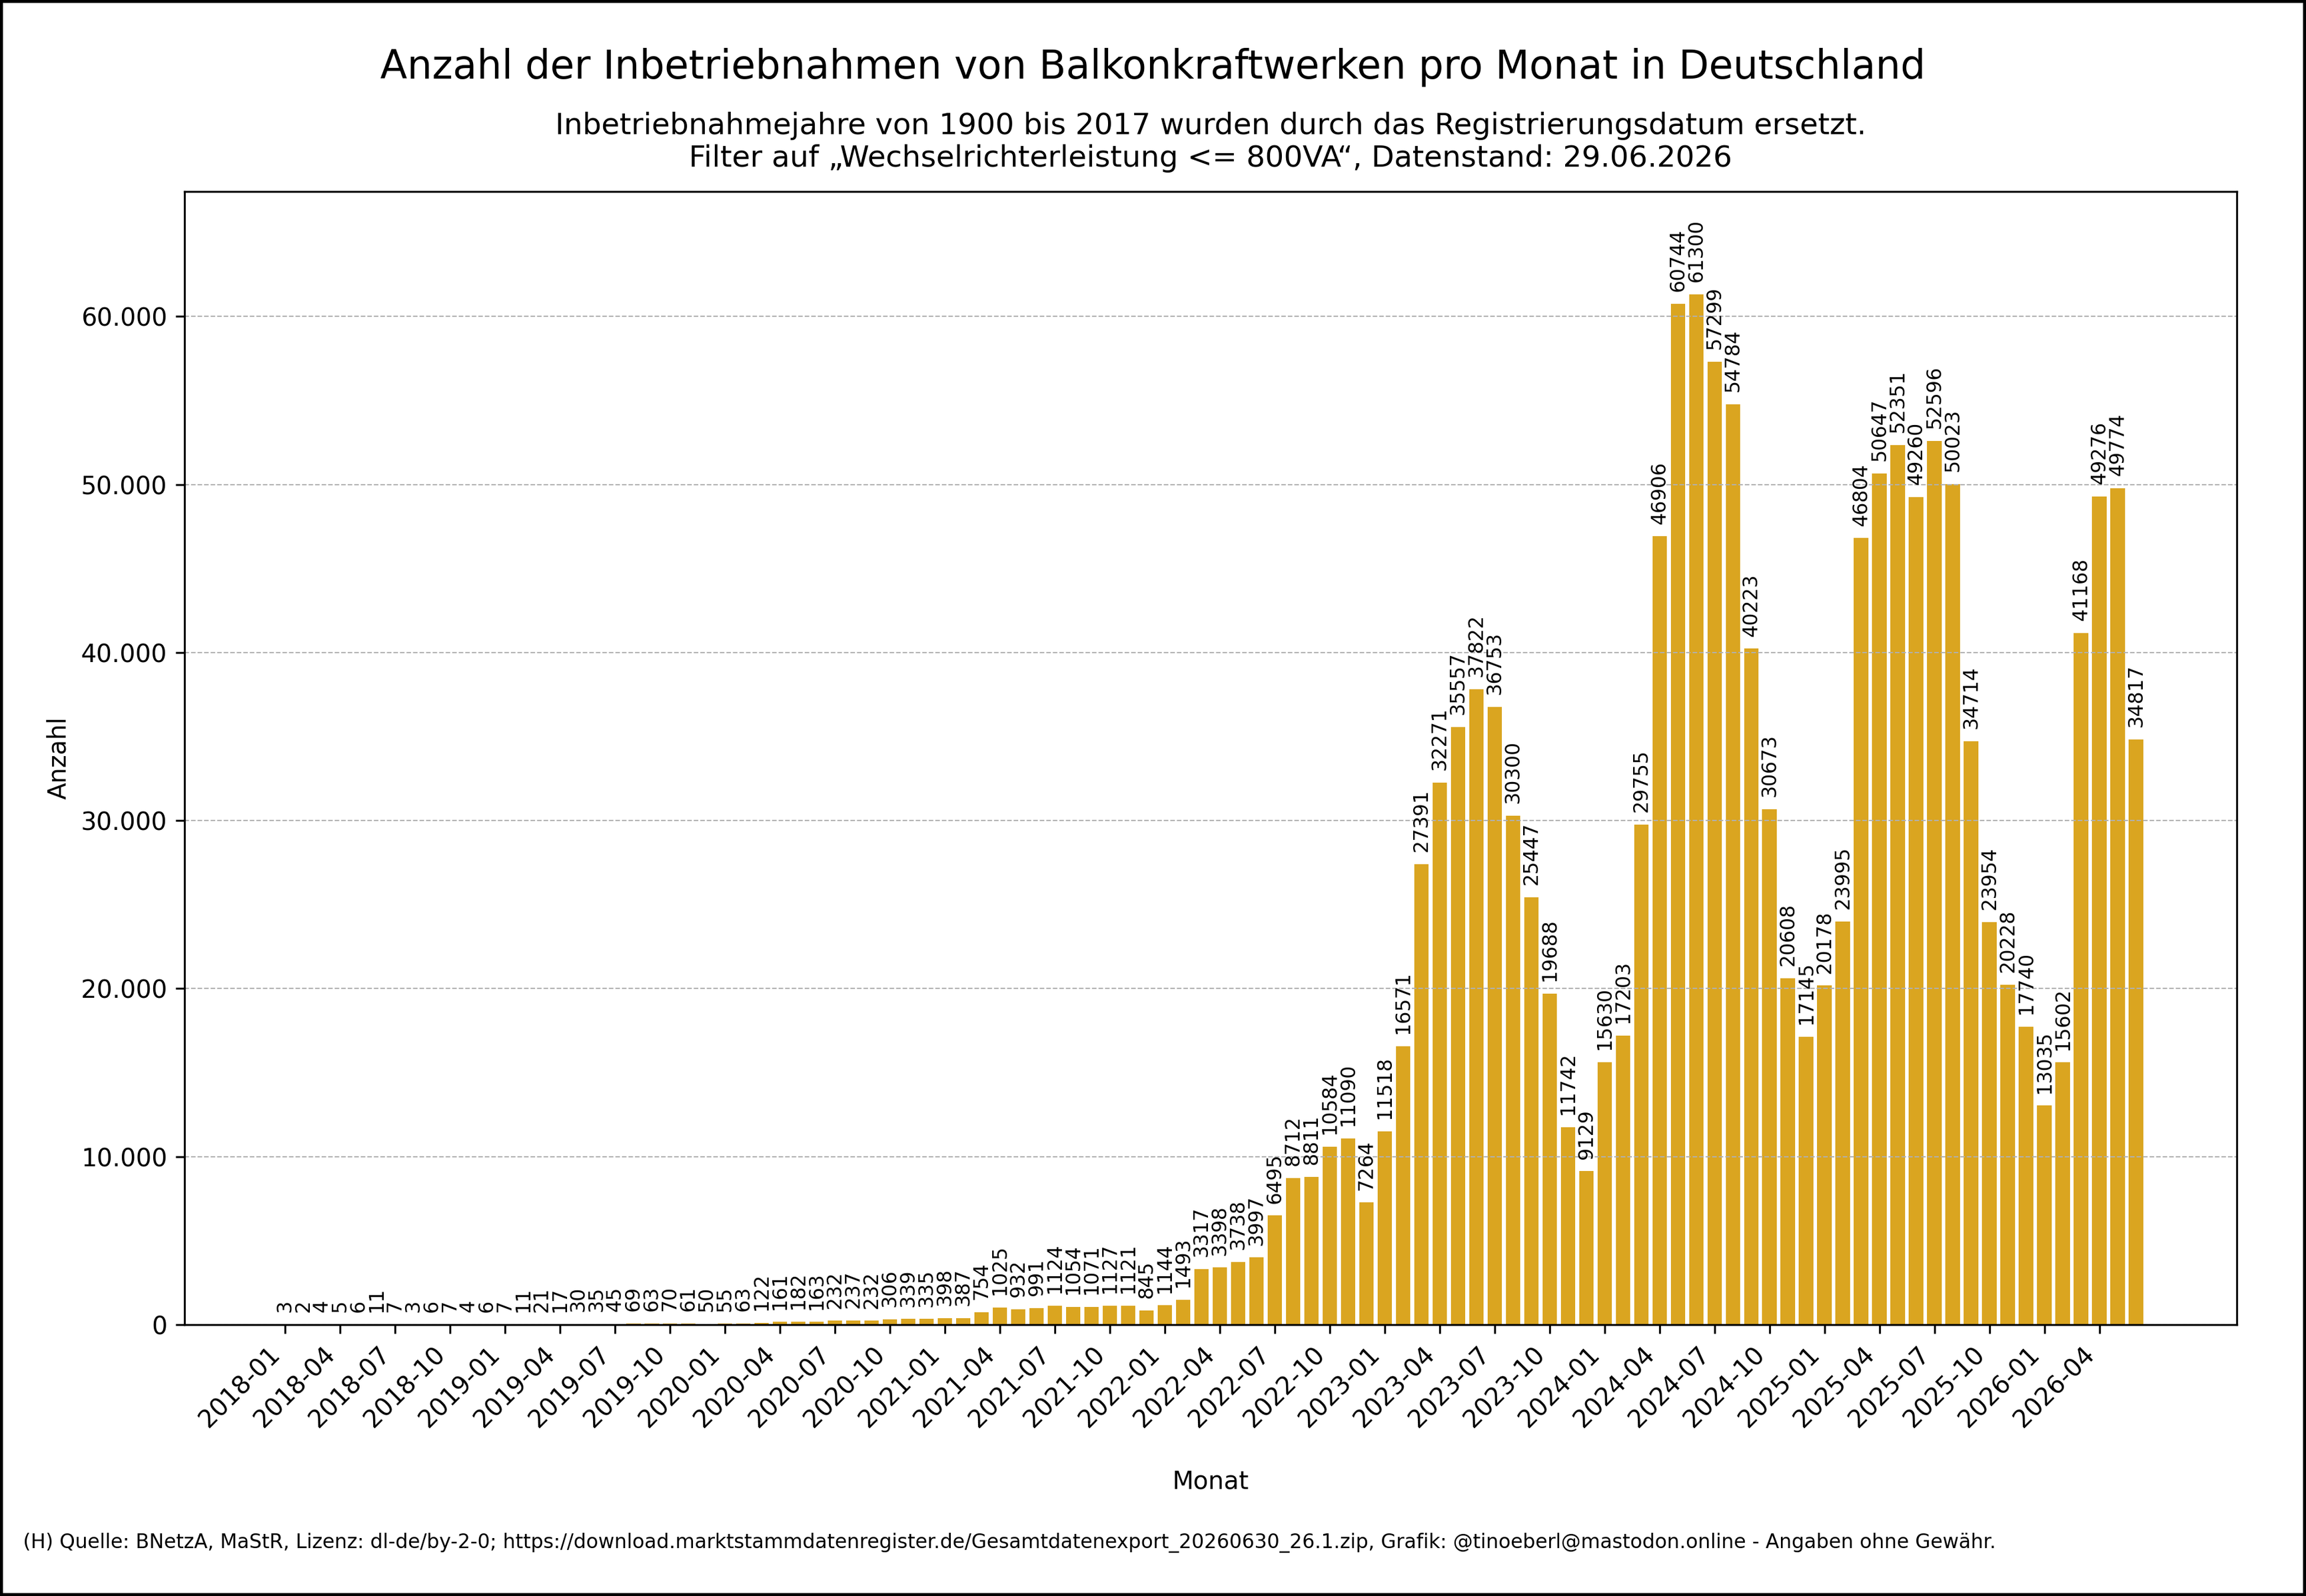
Anzahl der Inbetriebnahmen von #Balkonkraftwerken pro Monat in #Deutschland mit Stand vom 29.06.2026.
Unplausible Inbetriebnahmejahre von 1900 bis 2017 wurden durch das Registrierungsdatum der

Balkendiagramm zur monatlichen Anzahl der errichteten Balkonkraftwerke in Deutschland von 2018 bis 29.06.2026. Seit Mitte 2022 ist ein starker Anstieg zu erkennen, mit Spitzenwerten von über 60.000 Neuanlagen pro Monat im Jahr 2024. Der Zubau fällt 2025 etwas ab, bleibt aber auf hohem Niveau.
@hikingdude@mastodon.social
2026-04-20 16:36:29

I'm just cleaning up old video clips in my archive to reclaim some space.
And there I found this short clip from a #cycling tour near the #Tegernsee in summer 2022.
Well, needless to say that it can be quite frequented - it really IS a nice place! (and my

@arXiv_mathAT_bot@mastoxiv.page
2026-06-03 07:44:29

Cheeger Inequalities for the Persistent Laplacian
Magnus Bakke Botnan, Rui Dong
arxiv.org/abs/2606.02846 arxiv.org/pdf/2606.02846 arxiv.org/html/2606.02846
arXiv:2606.02846v1 Announce Type: new
Abstract: We study Cheeger-type inequalities for persistent Laplacians associated with inclusions of simplicial complexes $\mathcal{K}\hookrightarrow \mathcal{L}$. We introduce a persistent up $p$-Laplacian $\Delta_{q,p,\mathrm{up}}^{\mathcal{K},\mathcal{L}}$ for $p\geq 1$. For $p=2$, this recovers the usual persistent up Laplacian, while for $p=1$ it yields a nonzero persistent Cheeger constant $\varphi_q^{\mathcal{K},\mathcal{L}}$. We prove a Cheeger-type inequality relating $\varphi_q^{\mathcal{K},\mathcal{L}}$ to the smallest nonzero eigenvalue of $\Delta_{q,\mathrm{up}}^{\mathcal{K},\mathcal{L}}$. This gives a persistent extension of recent work by Jost and Zhang (Ann. Sc. Norm. Super. Pisa Cl. Sci., 2024; arXiv:2302.01069).
We then study two more structured settings. Under a locally complete $q$-skeleton assumption on $\mathcal{K}$, we extend the complete-skeleton isoperimetric inequality of Parzanchevski--Rosenthal--Tessler (Combinatorica, 2016; arXiv:1207.0638) to the persistent setting. For orientable $(q 1)$-dimensional pseudomanifolds, we prove a Kron-type reduction of the persistent up Laplacian to a vertex- and edge-weighted graph Laplacian, possibly with Dirichlet boundary terms, and obtain two-sided Cheeger inequalities; this is related to the dual-graph perspective in the work of Steenbergen--Klivans--Mukherjee (Adv. Appl. Math., 2014; arXiv:1209.5091). We also describe the nonzero persistent Cheeger constant $\varphi_q^{\mathcal{K},\mathcal{L}}$ explicitly in terms of the dual graph in the non-branching pseudomanifold case. Finally, for graph inclusions $H\hookrightarrow G$, we compare the persistent Cheeger constants introduced here with the Kron-reduction Cheeger constants of M\'emoli et al. (SIAM J. Math. Data Sci., 2022; arXiv:2012.02808).
toXiv_bot_toot

@tinoeberl@mastodon.online
2026-07-01 20:31:01

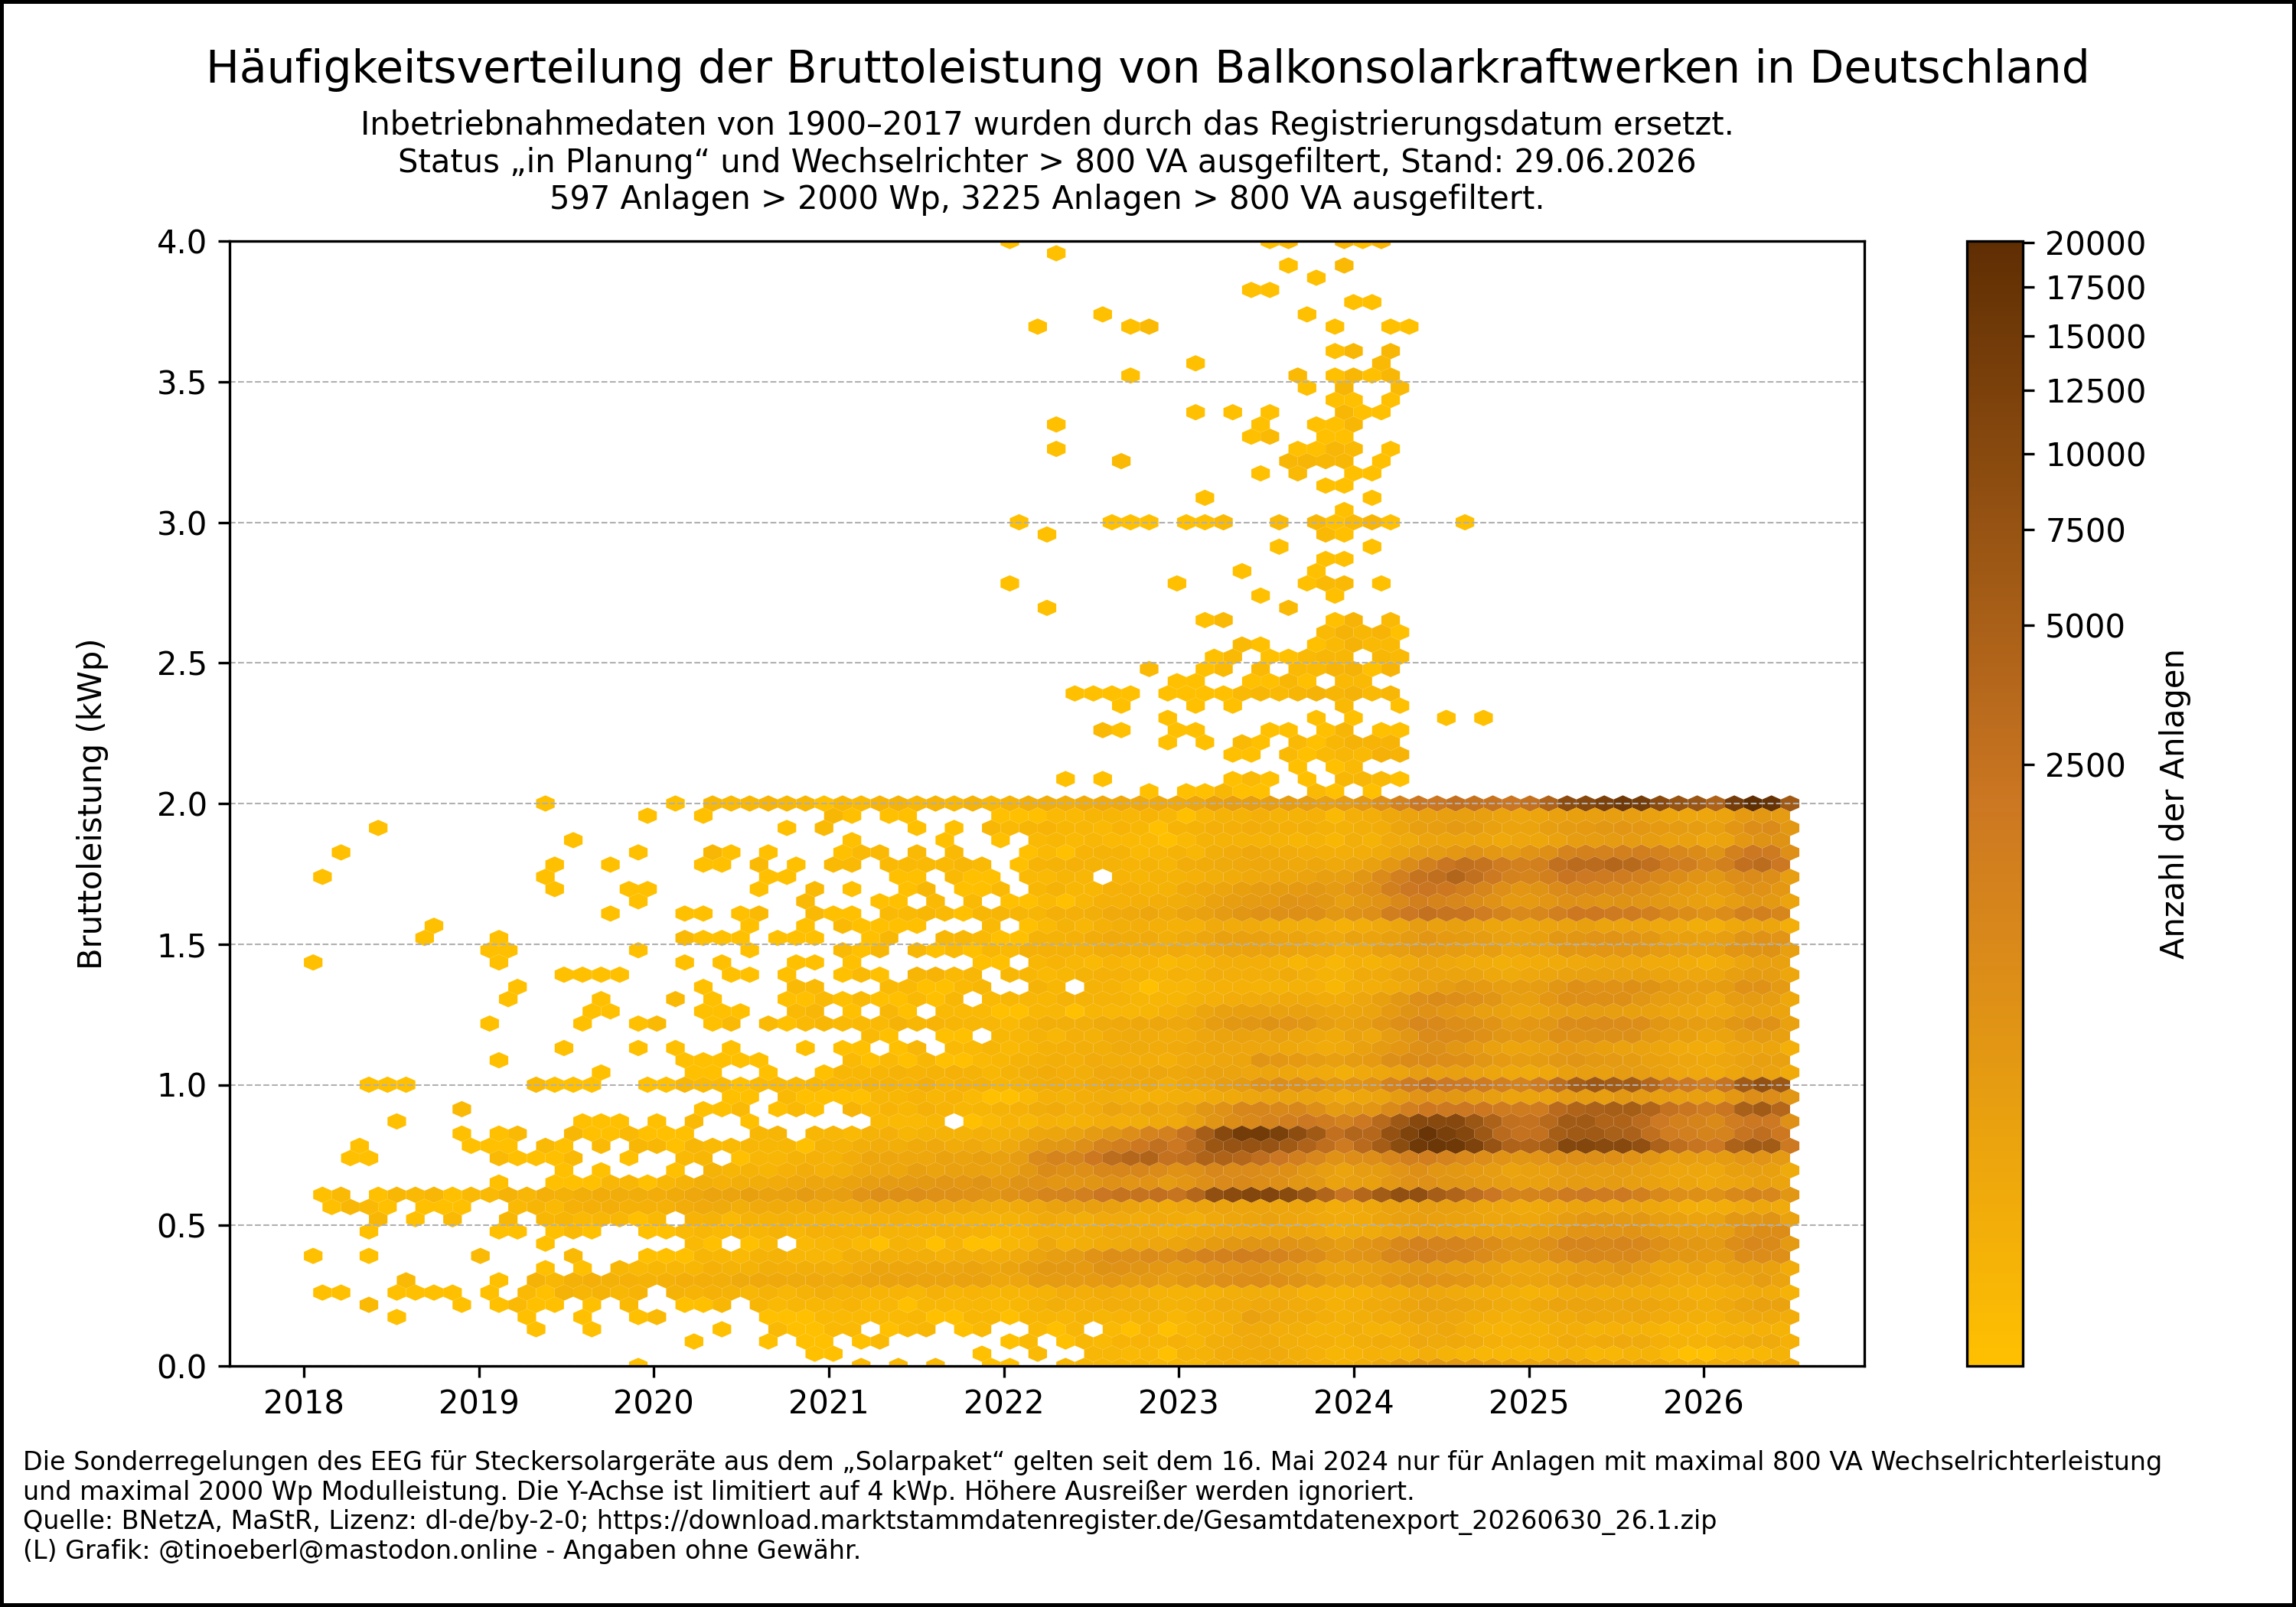
Häufigkeitsverteilung der Bruttoleistung von #Balkonkraftwerk​en in #Deutschland mit Stand vom 29.06.2026.
Unplausible Inbetriebnahmedaten vor 2018 durch Registrierungsdatum ersetzt. Sonderregelungen nach

Häufungspunkte-Diagramm der Bruttoleistung von Balkonkraftwerken in Deutschland. Das Diagramm zeigt die zeitliche Verteilung der Bruttoleistung (kWp) für über eine Million Anlagen – die meisten liegen unter 2 kWp, konzentriert ab 2022. Inbetriebnahmedaten von 1900–2017 wurden durch das Registrierungsdatum ersetzt. Anlagen mit Status „in Planung“ und Wechselrichter > 800 VA wurden ausgefiltert. Die Sonderregelungen des EEG für Steckersolargeräte aus dem „Solarpaket“ gelten seit dem 16. Mai 2024 …
@servelan@newsie.social
2026-07-08 18:37:29

"U.S. Court of Appeals for the 11th Circuit upheld a 2022 injunction against applying the law to colleges and universities"
Court issues major blow to DeSantis's "Stop WOKE Act" & calls it "a breathtaking assertion of power" - LGBTQ Nation
lgbtqnation.com/2026/07/court-

@tinoeberl@mastodon.online
2026-06-30 20:22:02

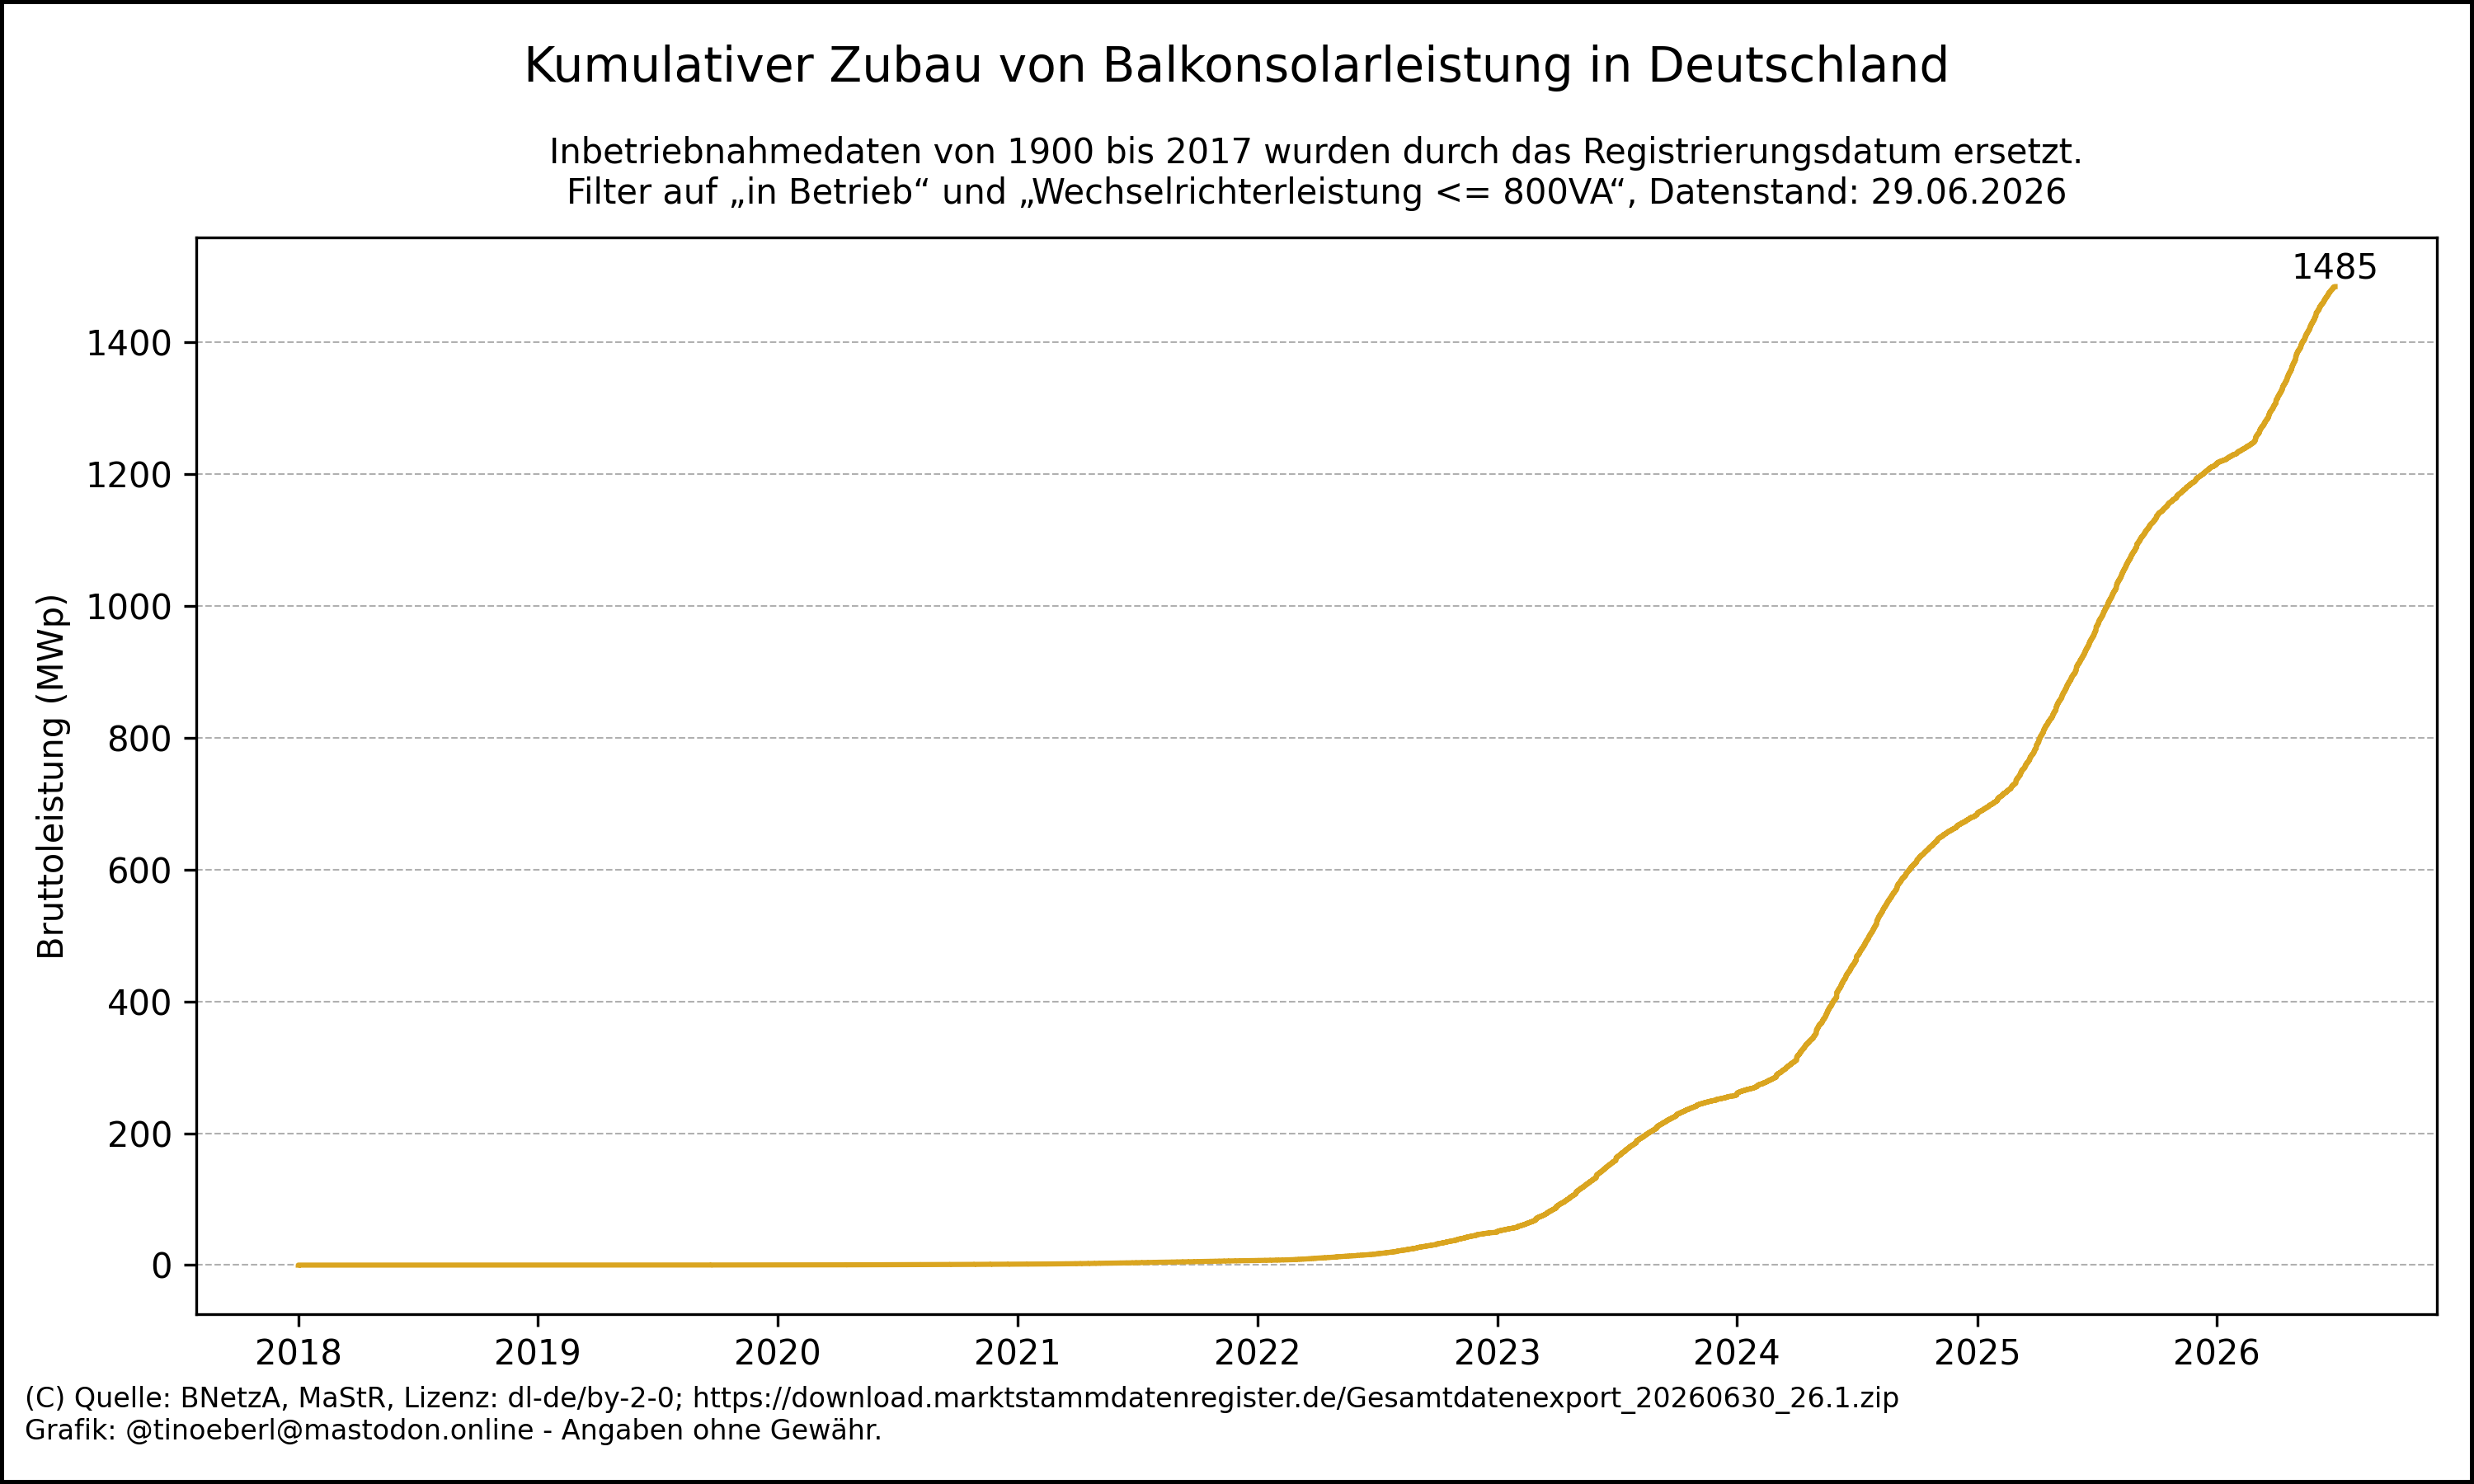
Kumulativer Zubau von #Balkonsolarleistung in #Deutschland mit Stand vom 29.06.2026.
Die summierte Leistung aller offiziell registrierten #Steckersolaranlagen beträgt b…

Liniendiagramm mit dem kumulierten Zubau von Balkonsolaranlagen in Deutschland von 2018 bis 29.06.2026. Die gelbe Linie zeigt die Bruttoleistung in Megawatt-Peak (MWp) über die Zeit. Bis 2021 verläuft die Kurve fast waagrecht. Ab 2022 beginnt ein kontinuierlicher Anstieg, der ab 2023 deutlich steiler wird. Ab 2024 ist der Zubau stark beschleunigt. Der Höchststand liegt aktuell bei 1484,52 Megawatt peak. Die Kurve deutet auf einen anhaltenden Boom hin.
@tinoeberl@mastodon.online
2026-07-01 18:29:02

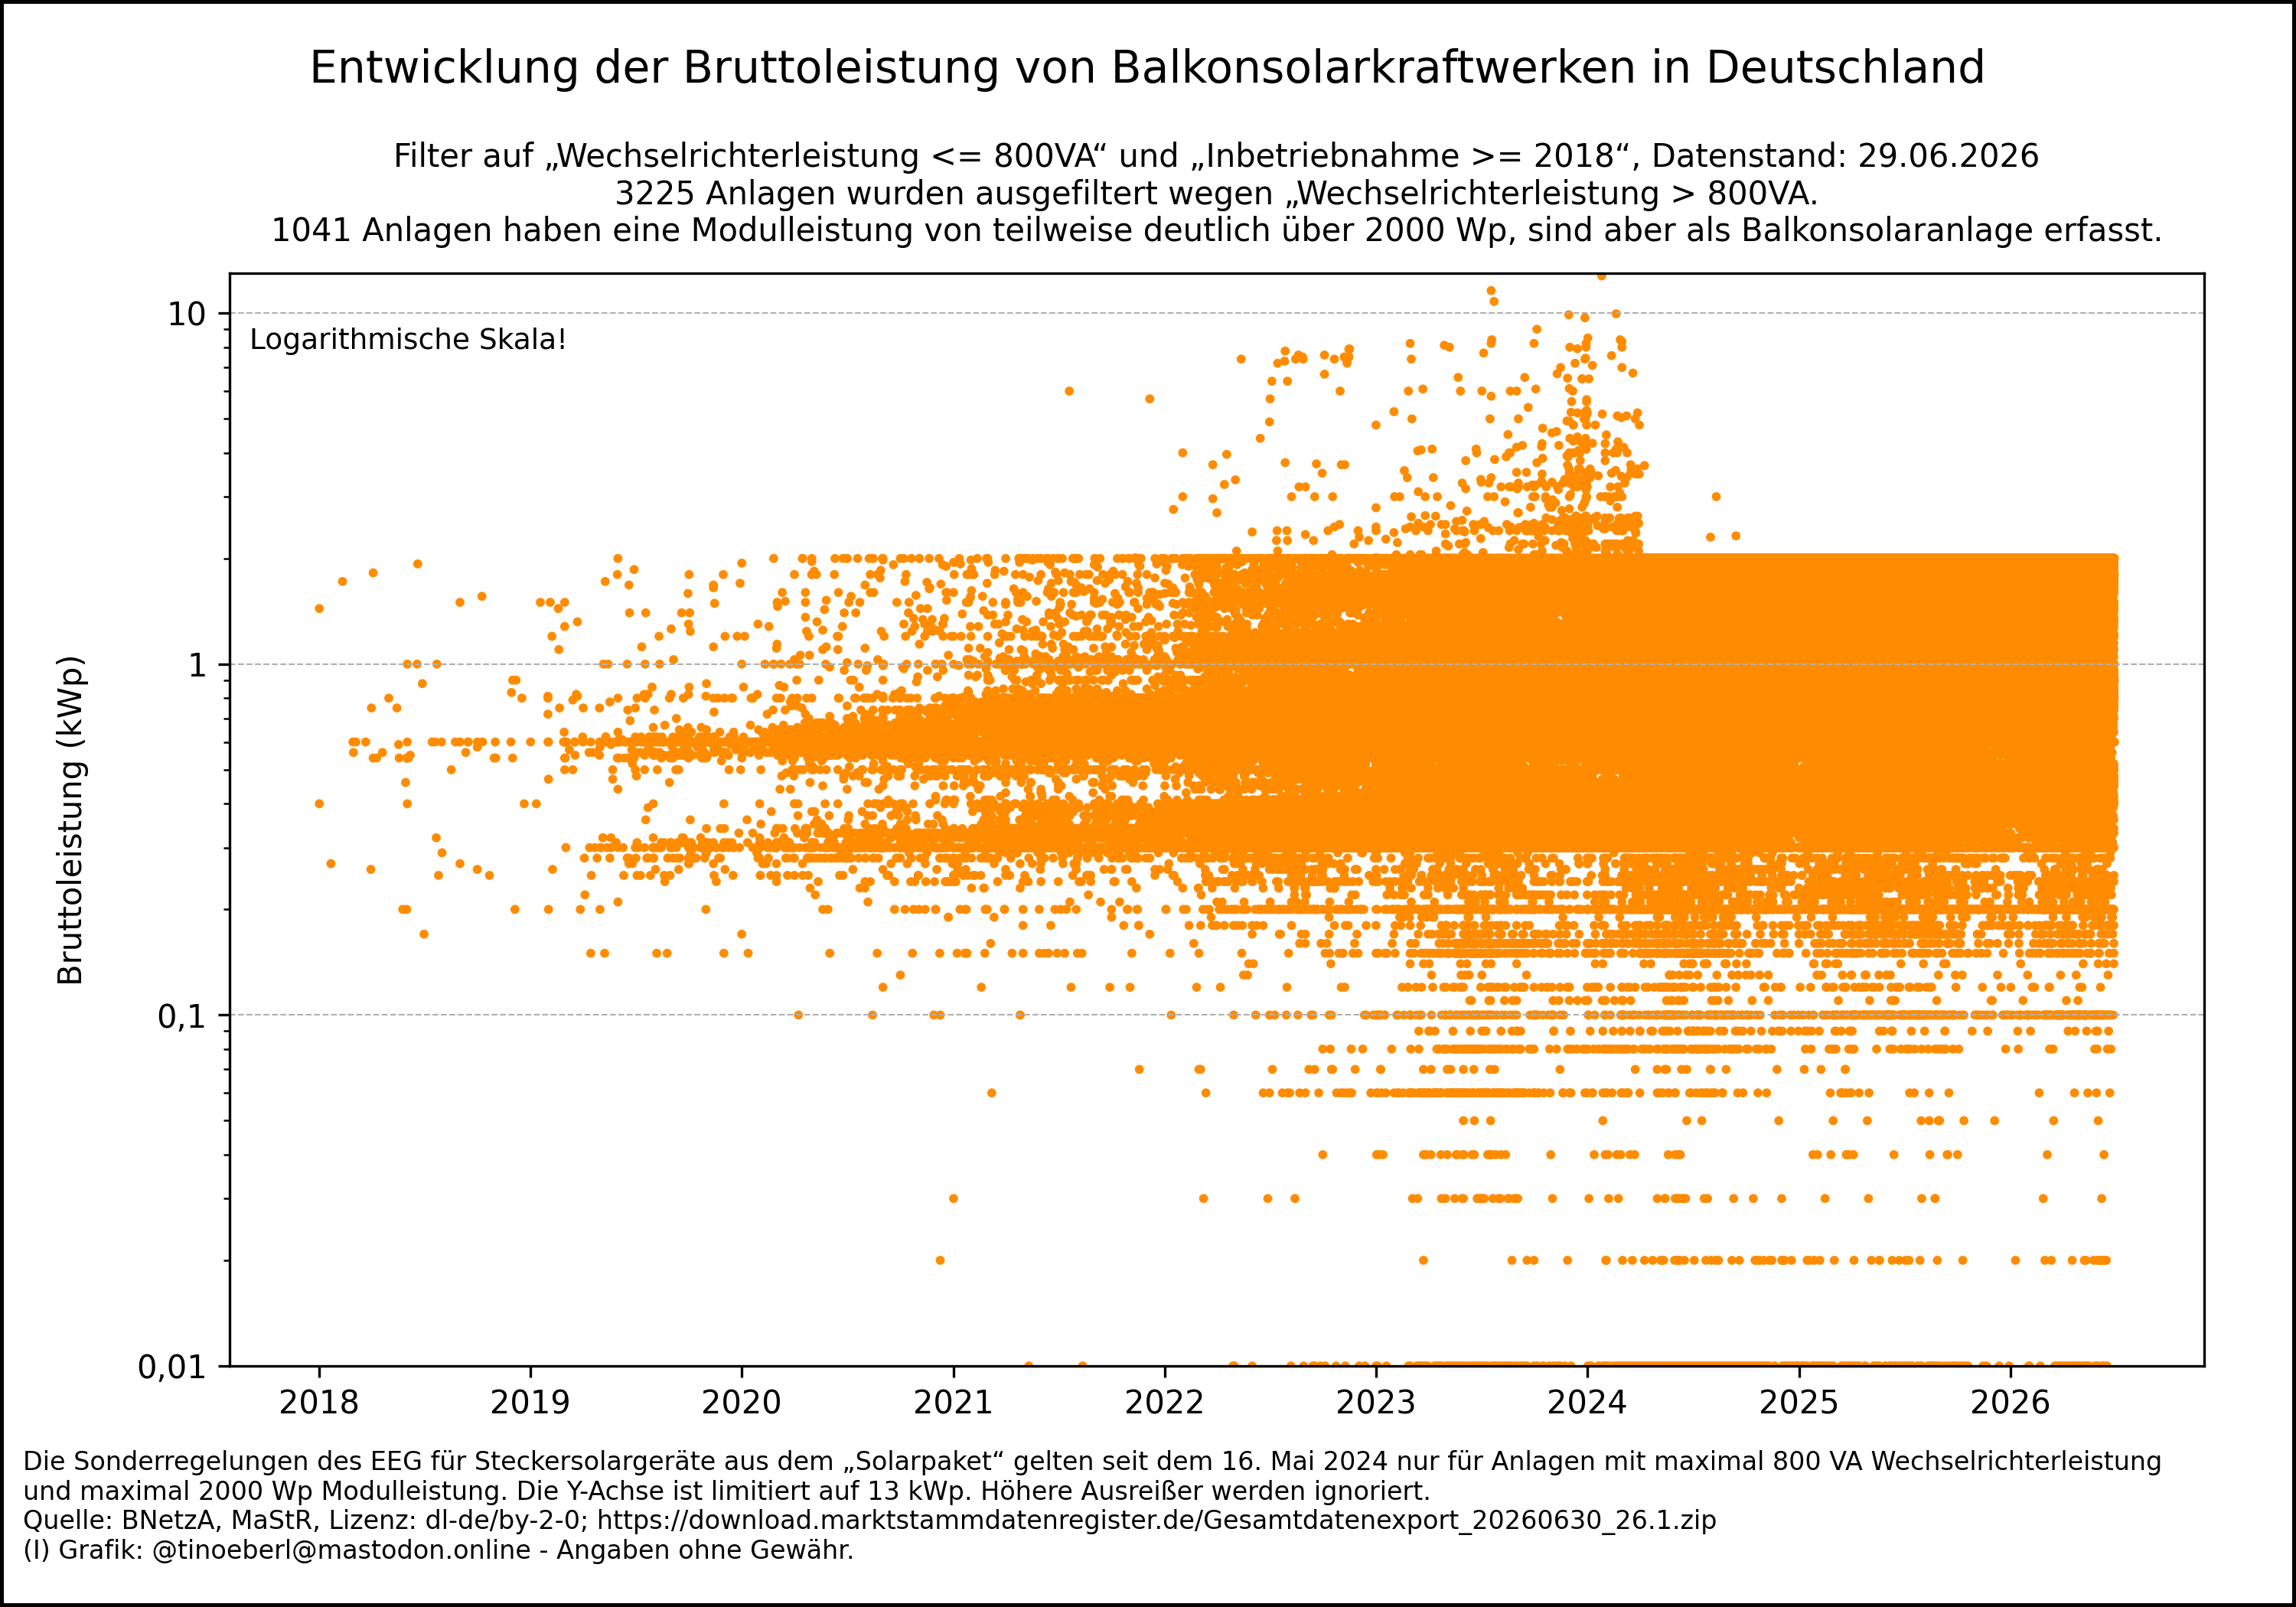
#Streudiagramm der #Bruttoleistung von #Balkonkraftwerk​en in #Deutschland mit …

Streudiagramm  Entwicklung der Bruttoleistung von Balkonsolarkraftwerken in Deutschland mit Stand vom 29.06.2026. Ein Streudiagramm zeigt die Entwicklung der Bruttoleistung (kWp) von Balkonsolarkraftwerken in Deutschland ab 2018. Jeder orange Punkt steht für eine Anlage. Die meisten Anlagen liegen unter 2 kWp, mit Ausreißern bis über 30 kWp. Die Anzahl und Leistung steigen ab 2022 deutlich an und sind anscheinend mit Inkrafttreten des „Solarpaketes“ am 16. Mai 2024 auf 2 kWp begrenzt.