A 2022 risk assessment by the Bucharest City Committee for Emergency Situations estimated that
a major earthquake could severely damage about 23,000 buildings across the city,
kill approximately 6,500 people
and leave a further 16,000 seriously injured
https…
Heute vor 61 Jahren: Am 16. Juli 1965 zündeten die #USA im Rahmen von Operation Whetstone die Atombombe "Bye". Whetstone war eine Serie von #Kernwaffentests bei der 1964/65 insgesamt 46 Bomben größtenteils im Testgebiet in
As in many US resort areas,
the suicide rates in the Tahoe region,
including the city of Truckee,
are far higher than the state average
– and these communities don’t have enough resources to deal with the issue.
Since 2022, there have been nearly 40 confirmed suicide deaths in Truckee,
South Lake Tahoe and four lakeside counties,
an area with a combined population of about 73,000,
according to an analysis by the Tahoe Daily Tribune.
Nearl…
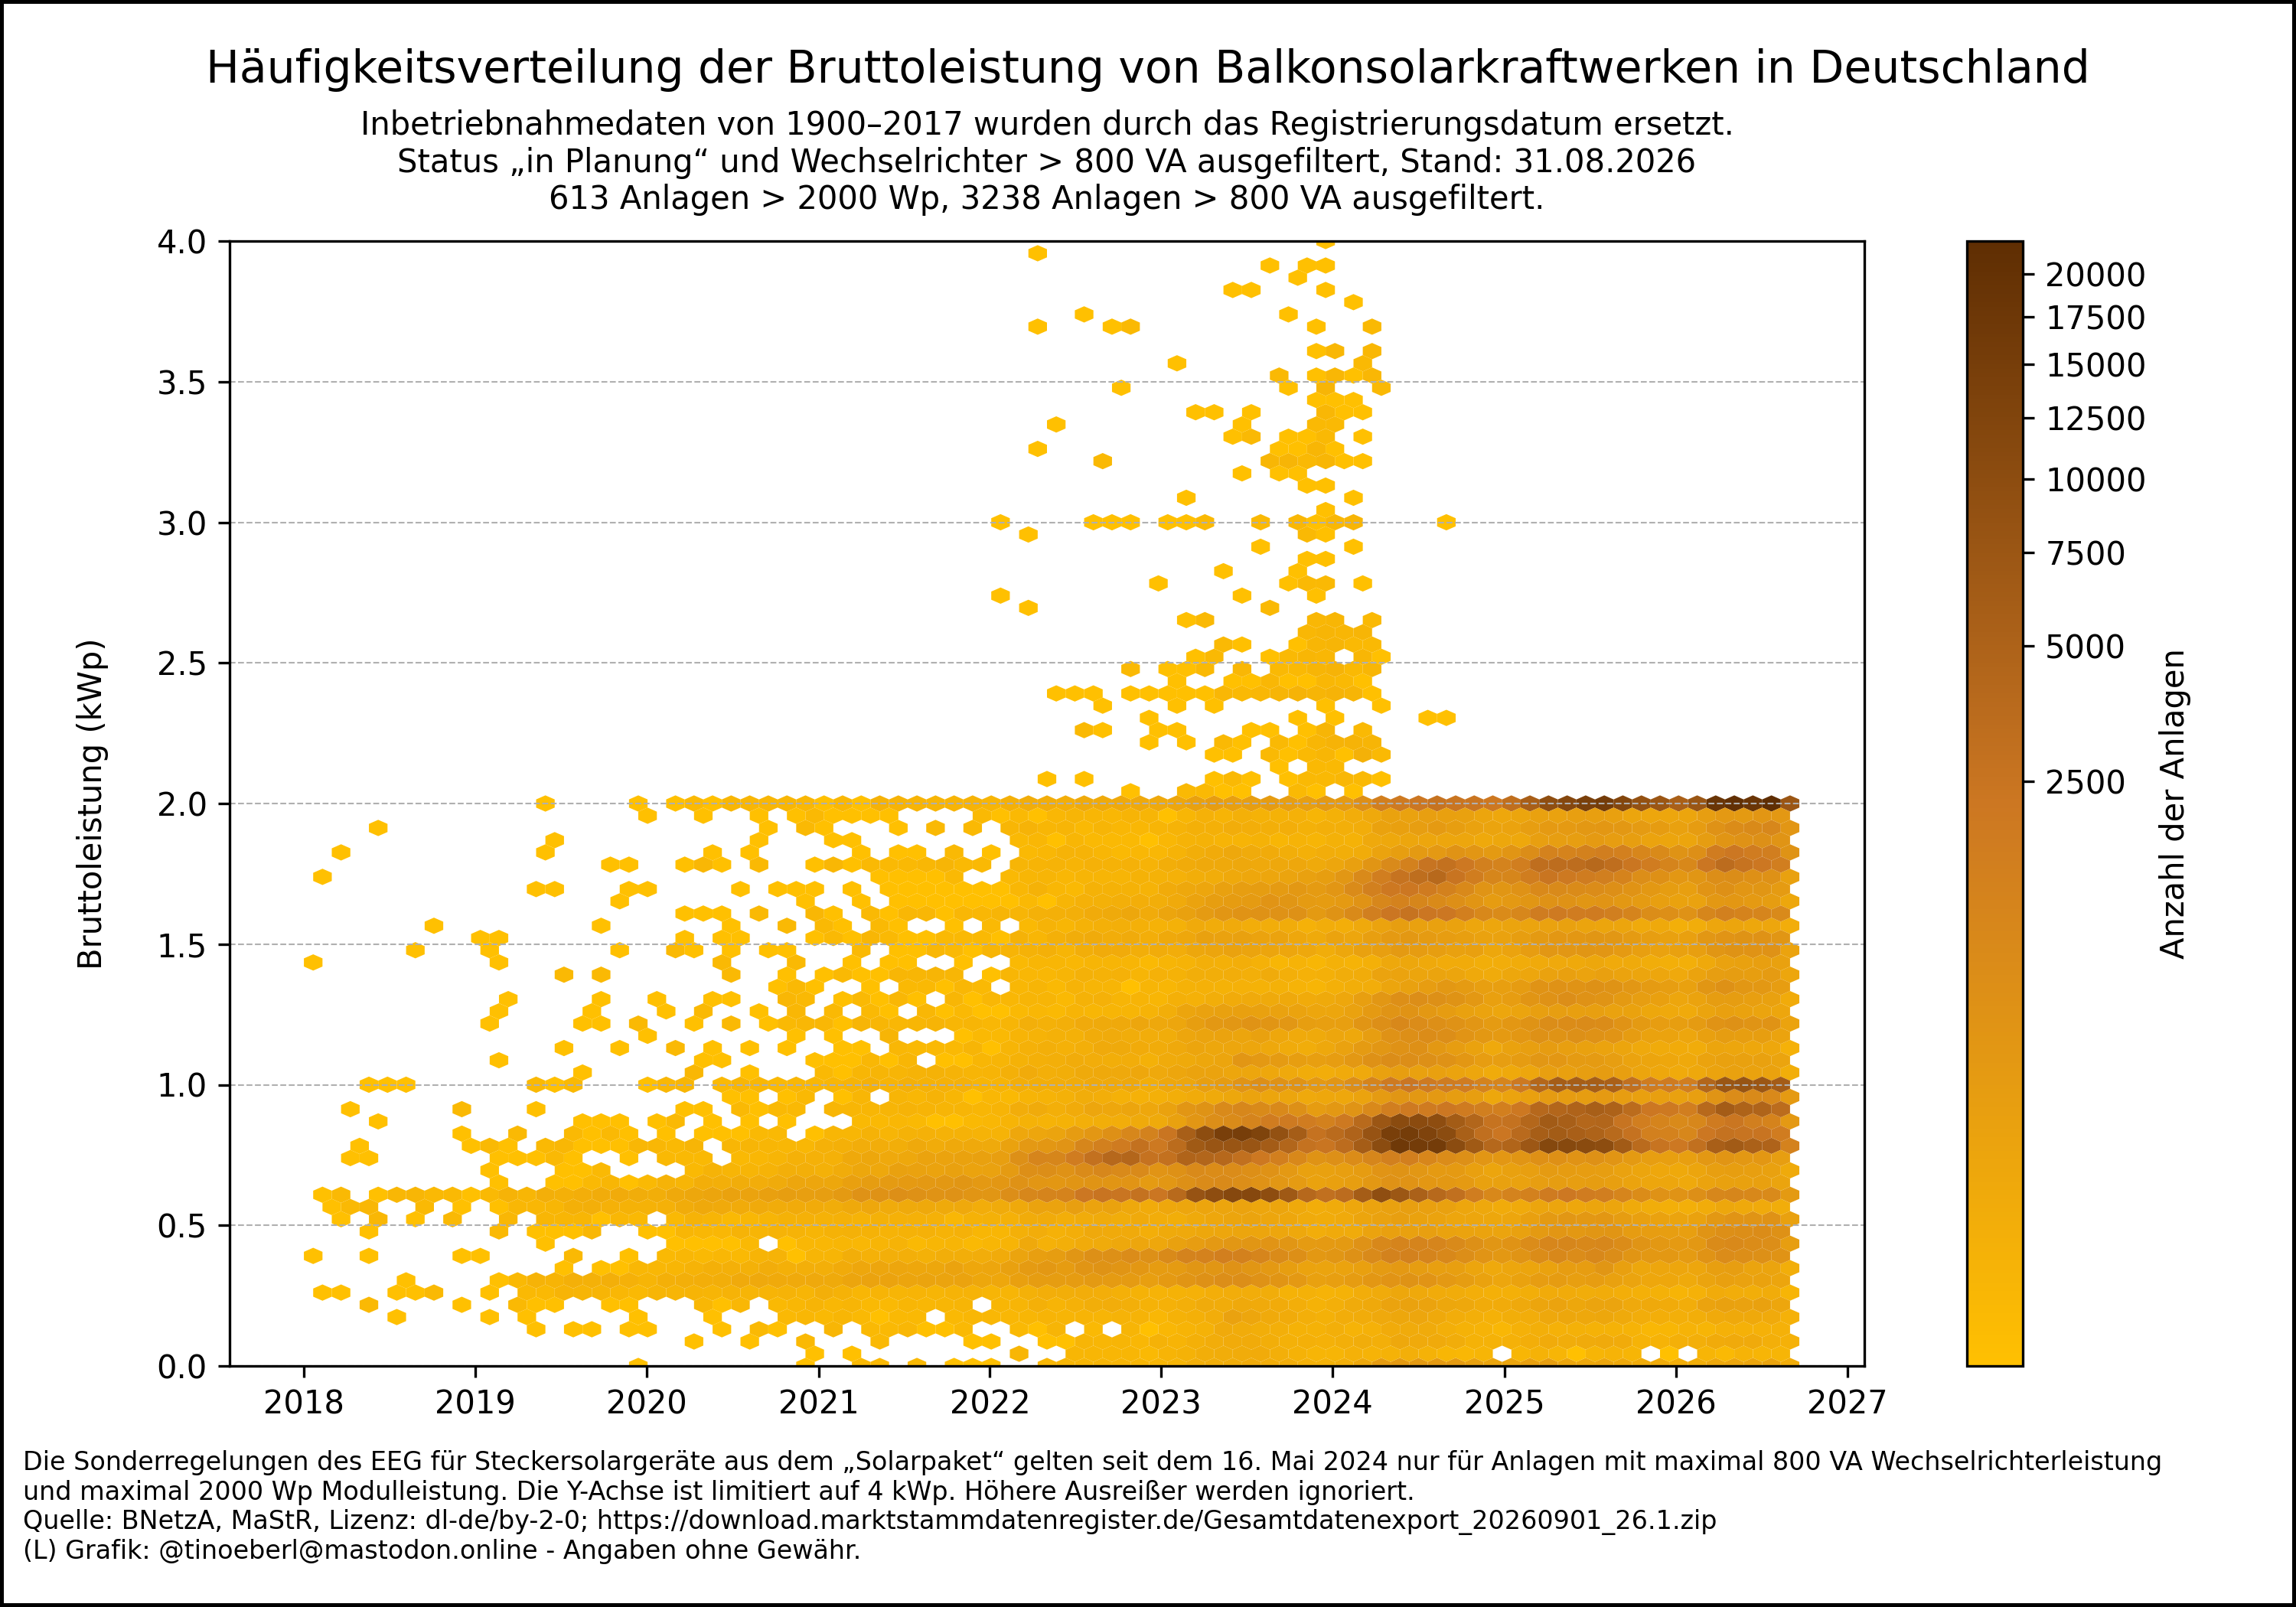
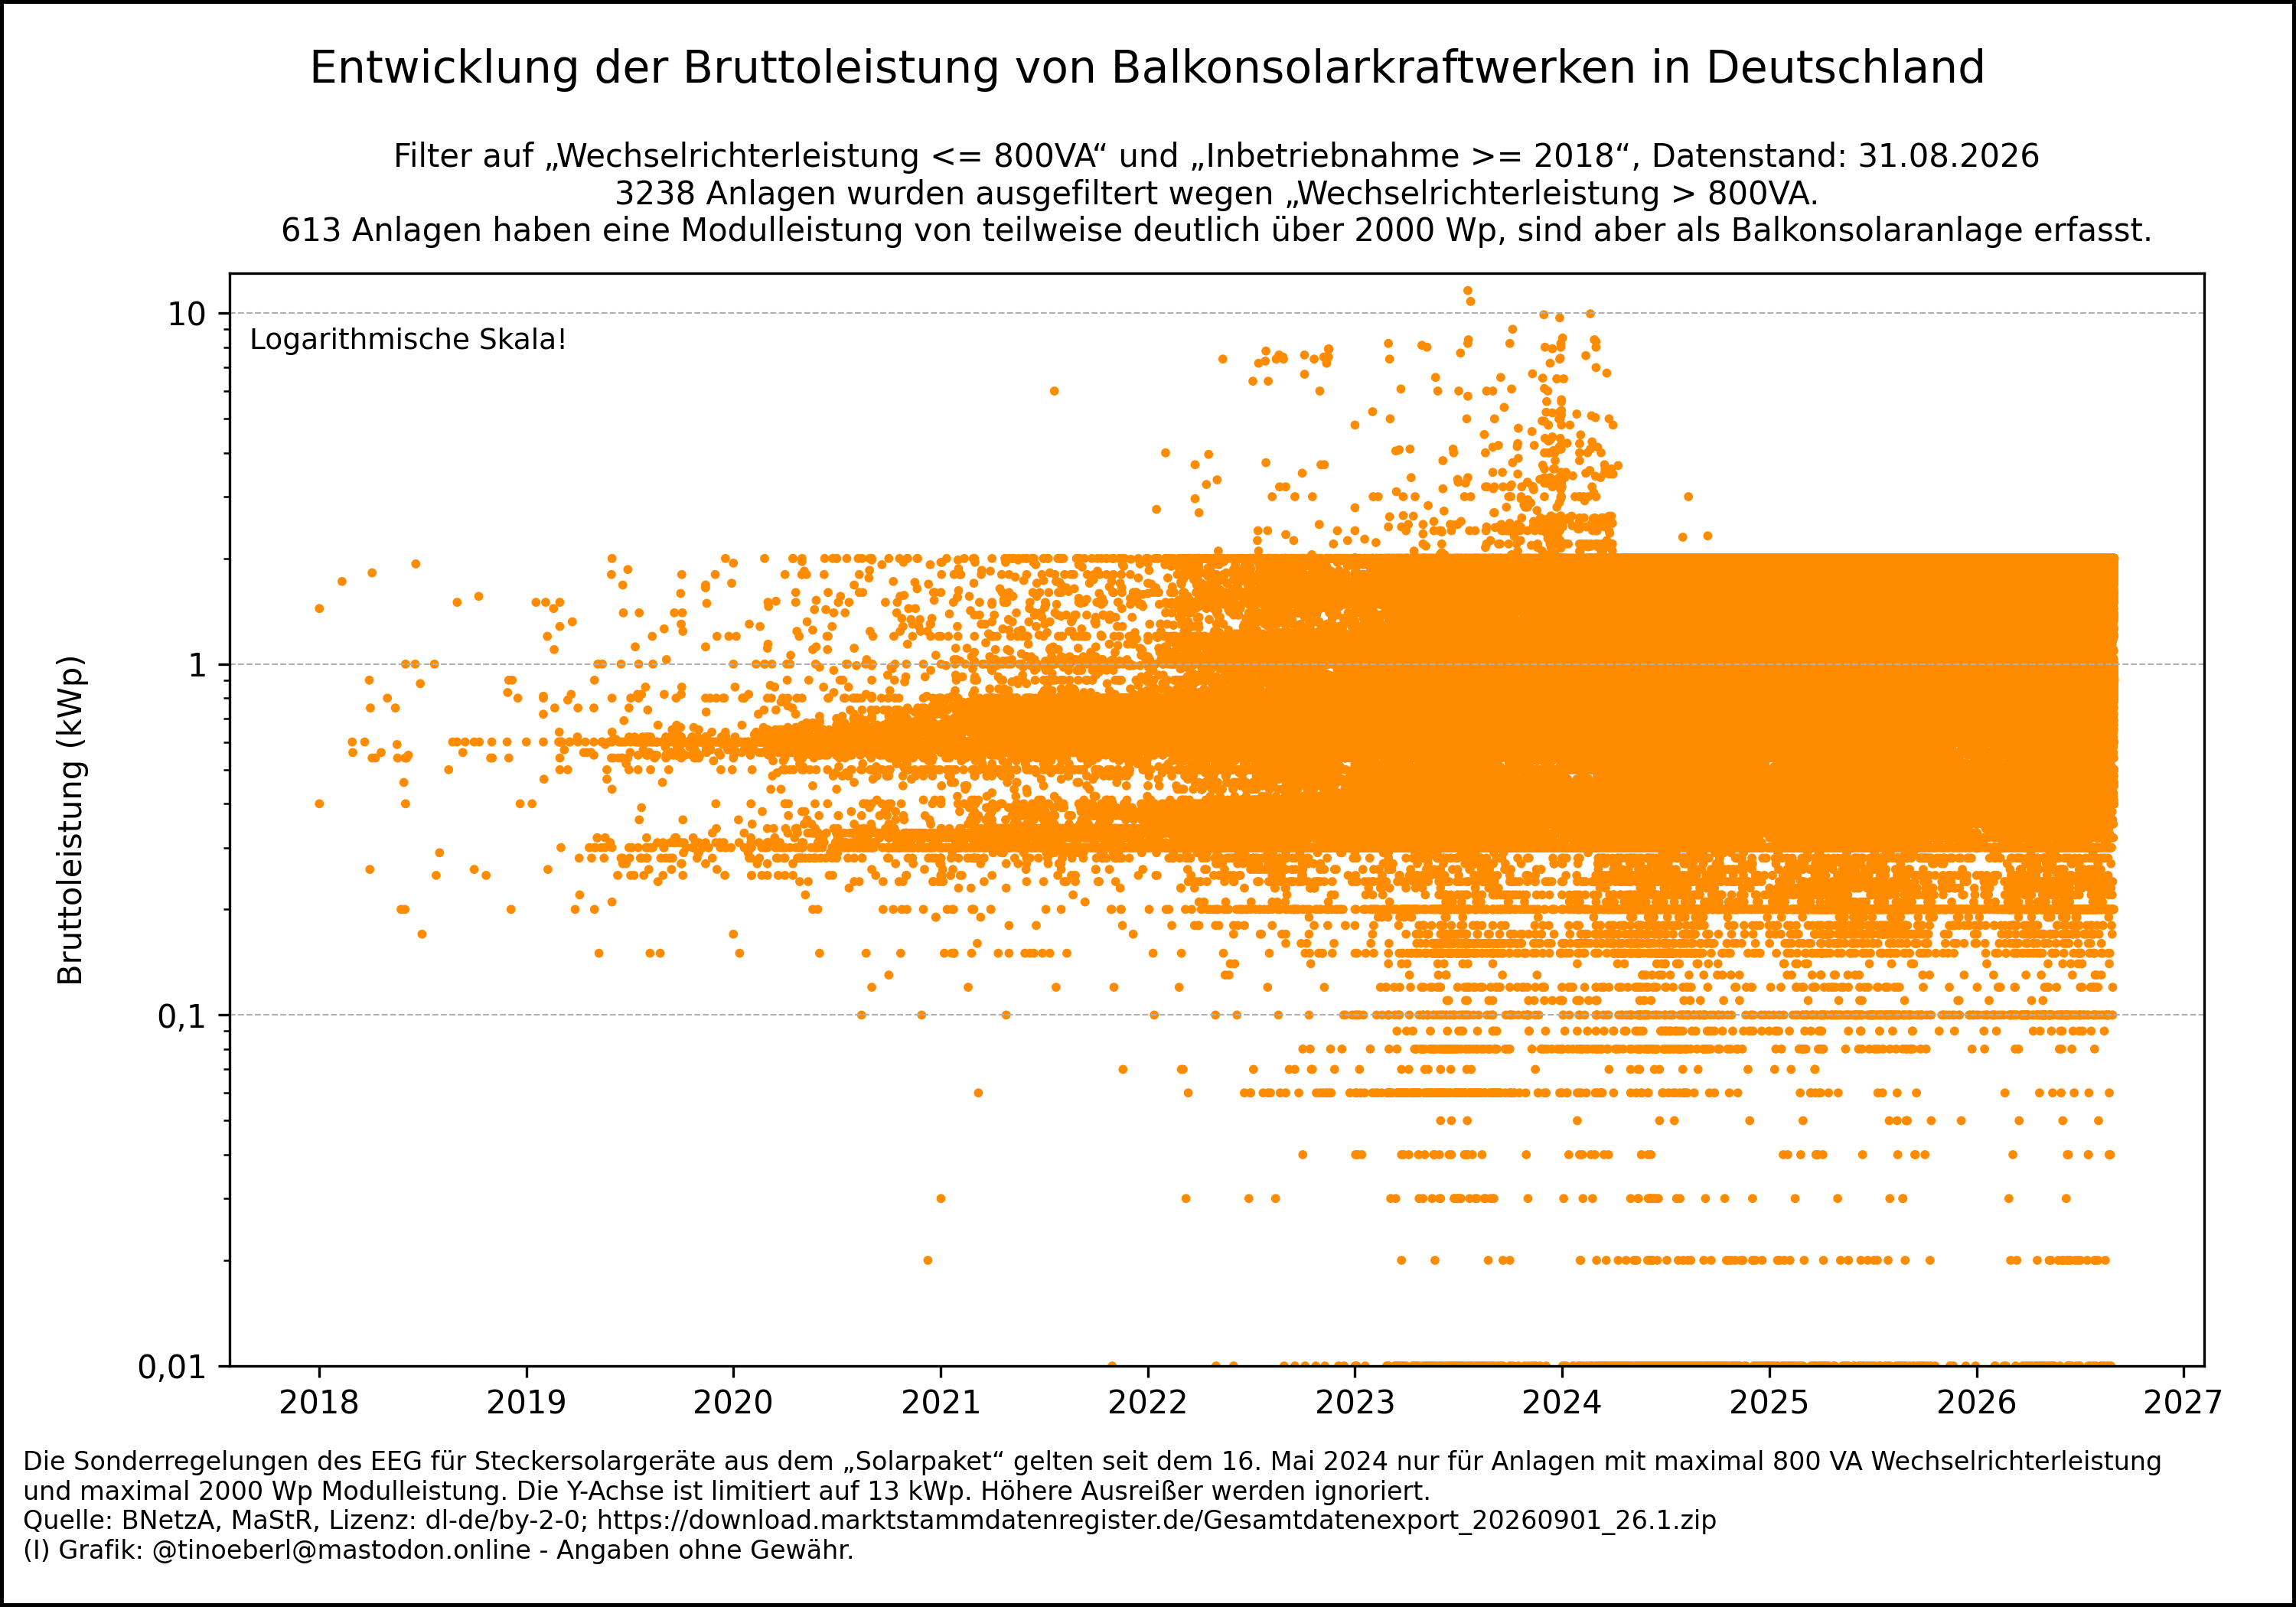
Häufigkeitsverteilung der Bruttoleistung von #Balkonkraftwerken in #Deutschland mit Stand vom 31.08.2026.
Unplausible Inbetriebnahmedaten vor 2018 durch Registrierungsdatum ersetzt. Sonderregelungen nach
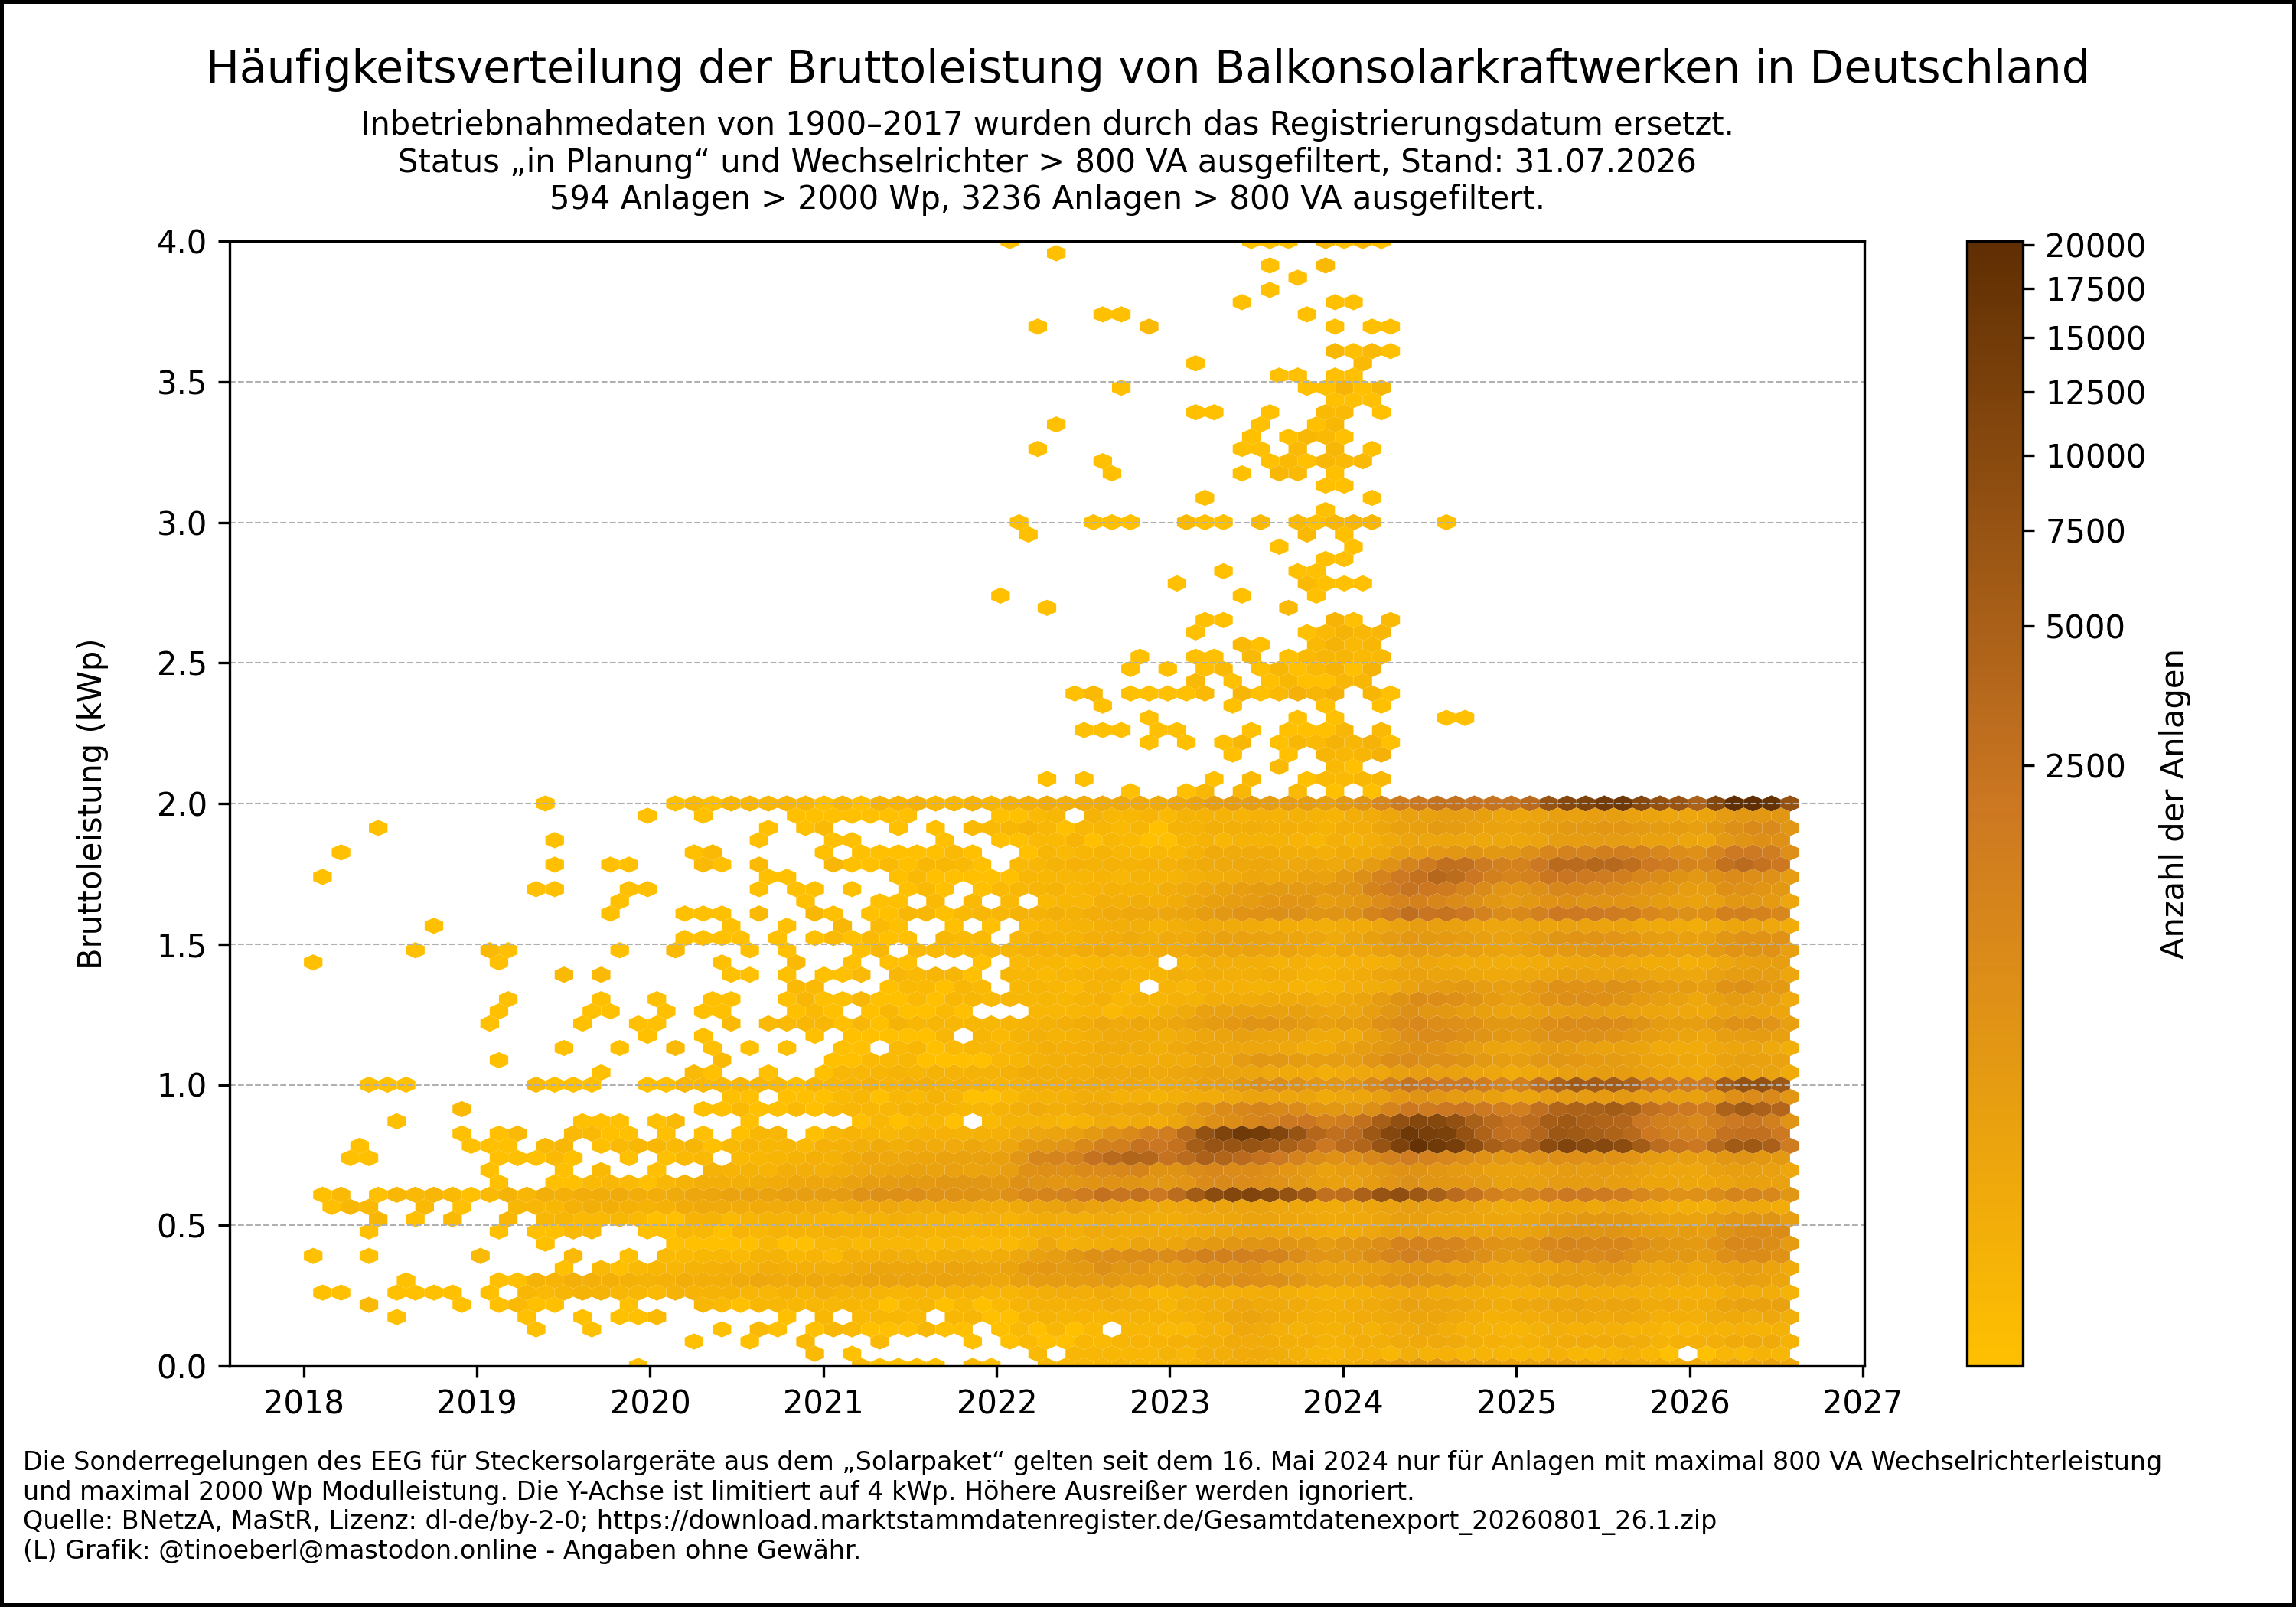
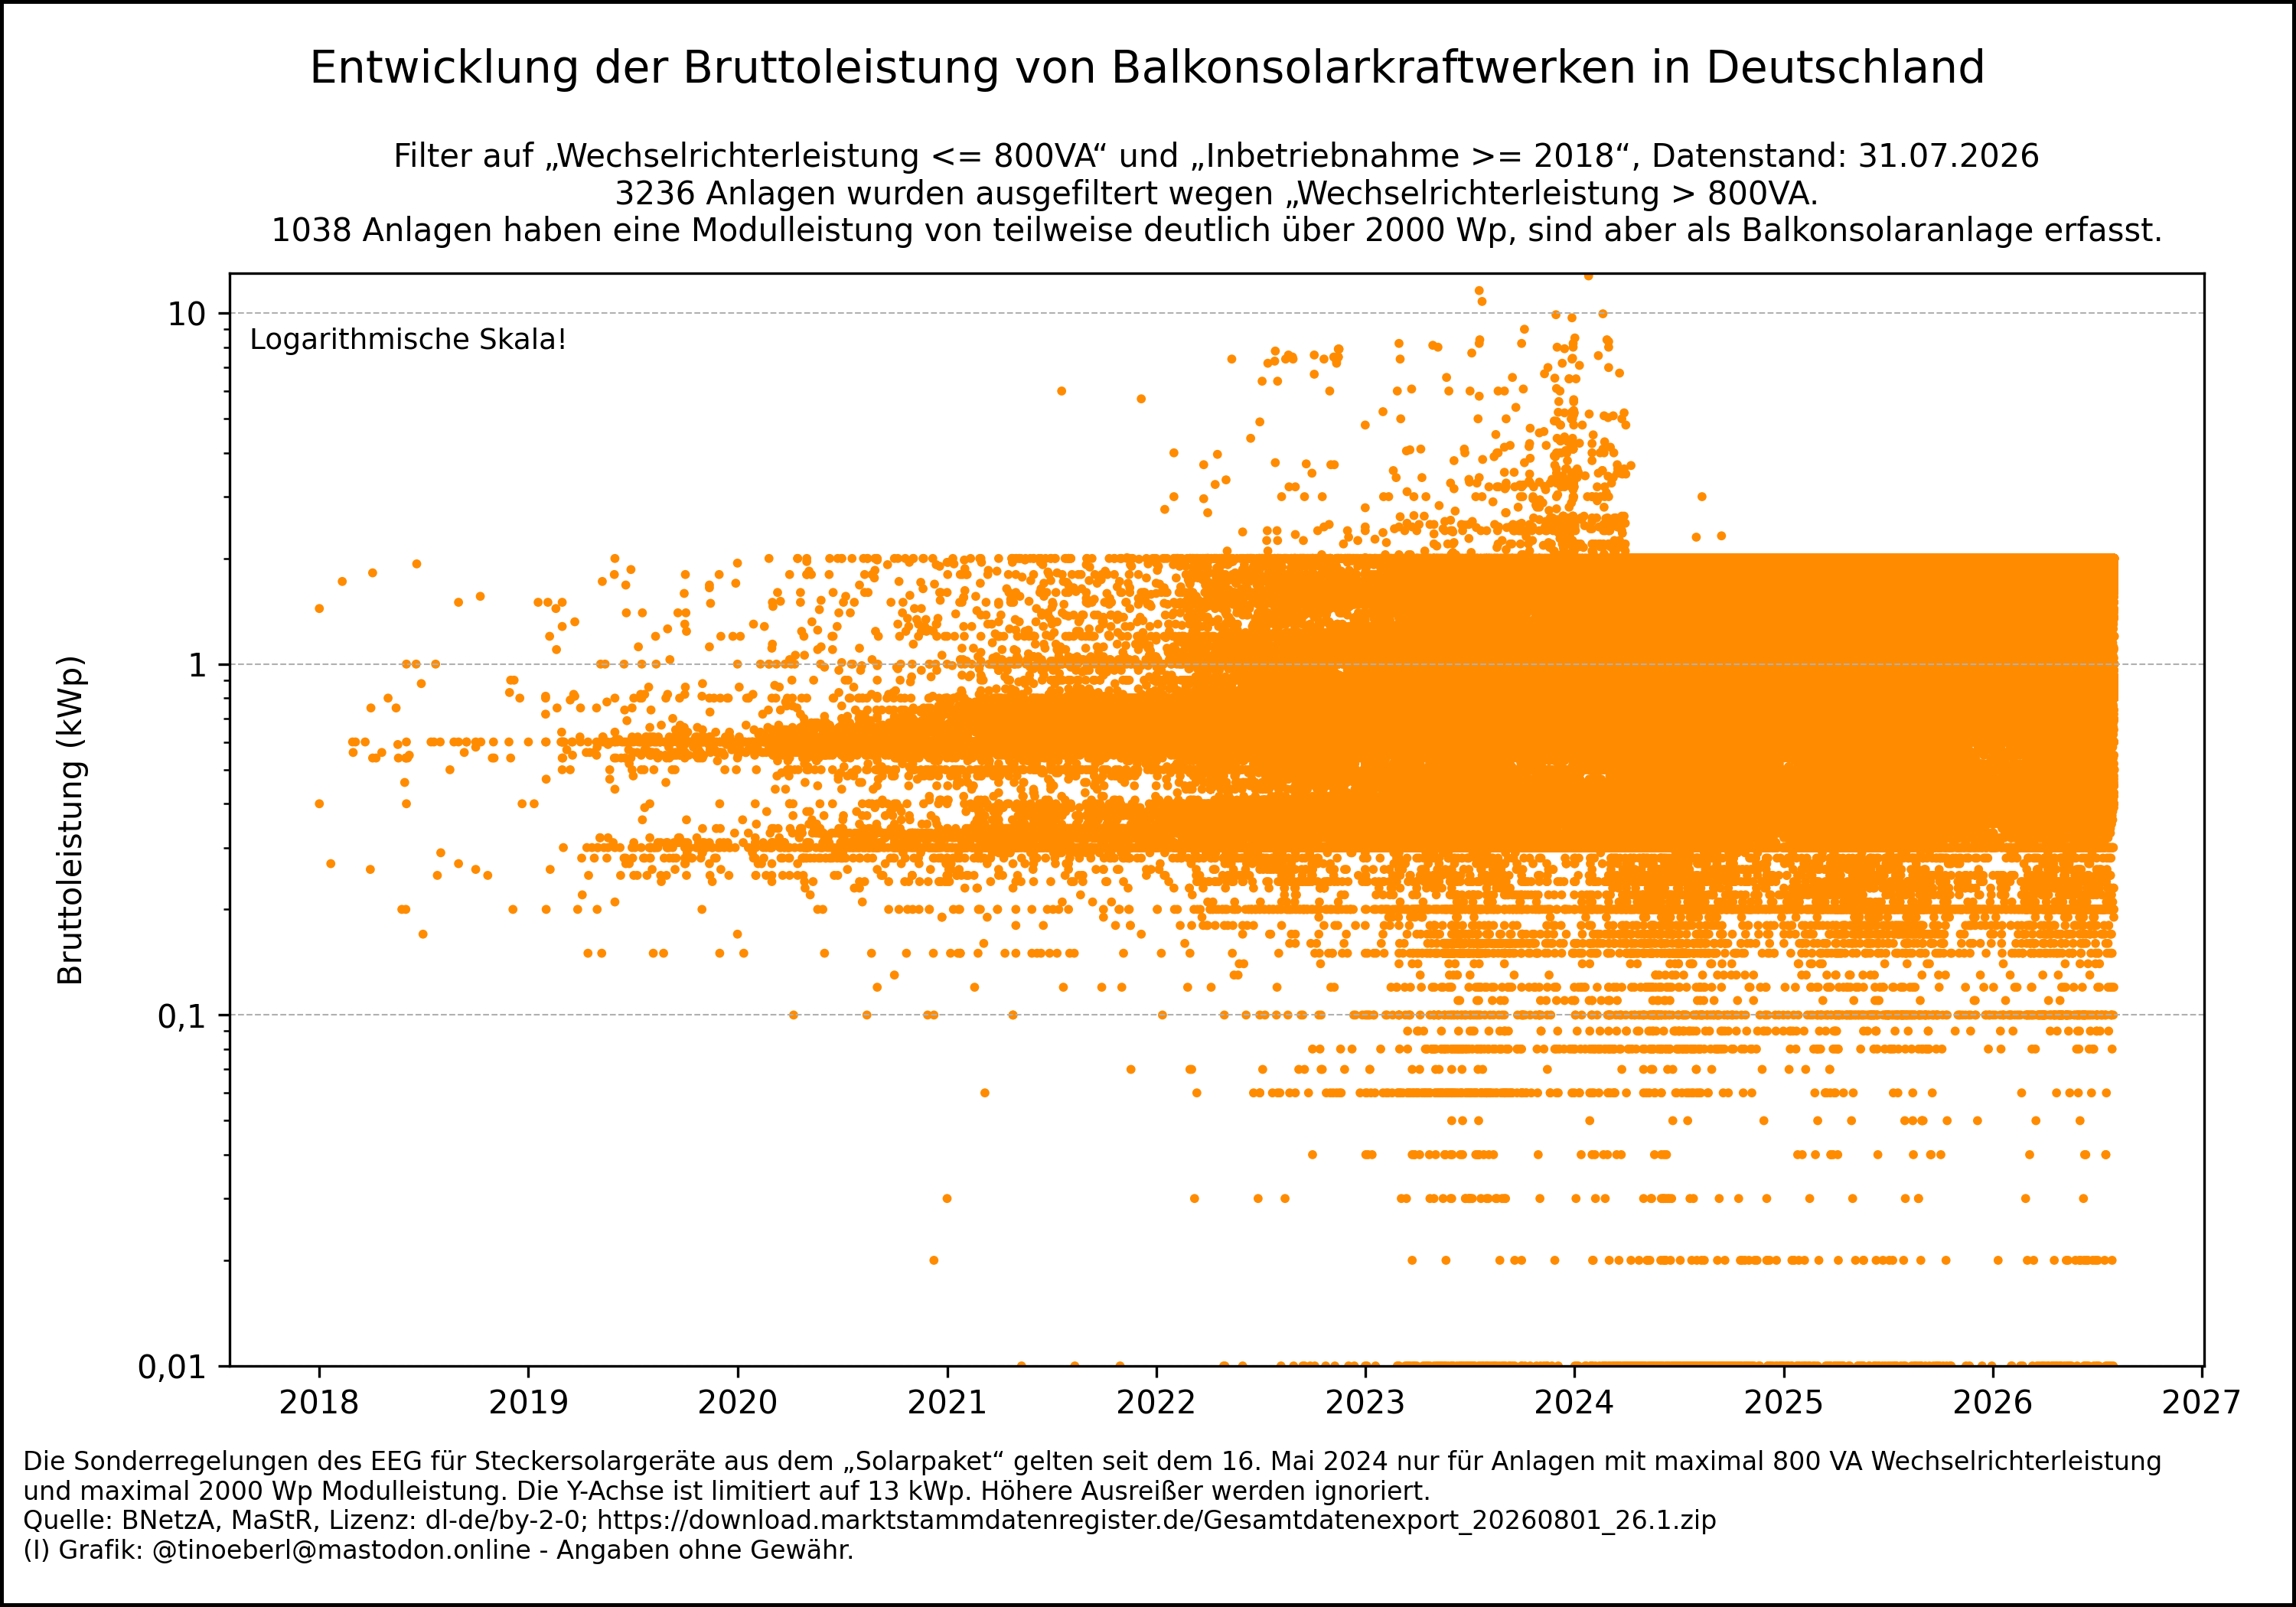
Häufigkeitsverteilung der Bruttoleistung von #Balkonkraftwerken in #Deutschland mit Stand vom 31.07.2026.
Unplausible Inbetriebnahmedaten vor 2018 durch Registrierungsdatum ersetzt. Sonderregelungen nach
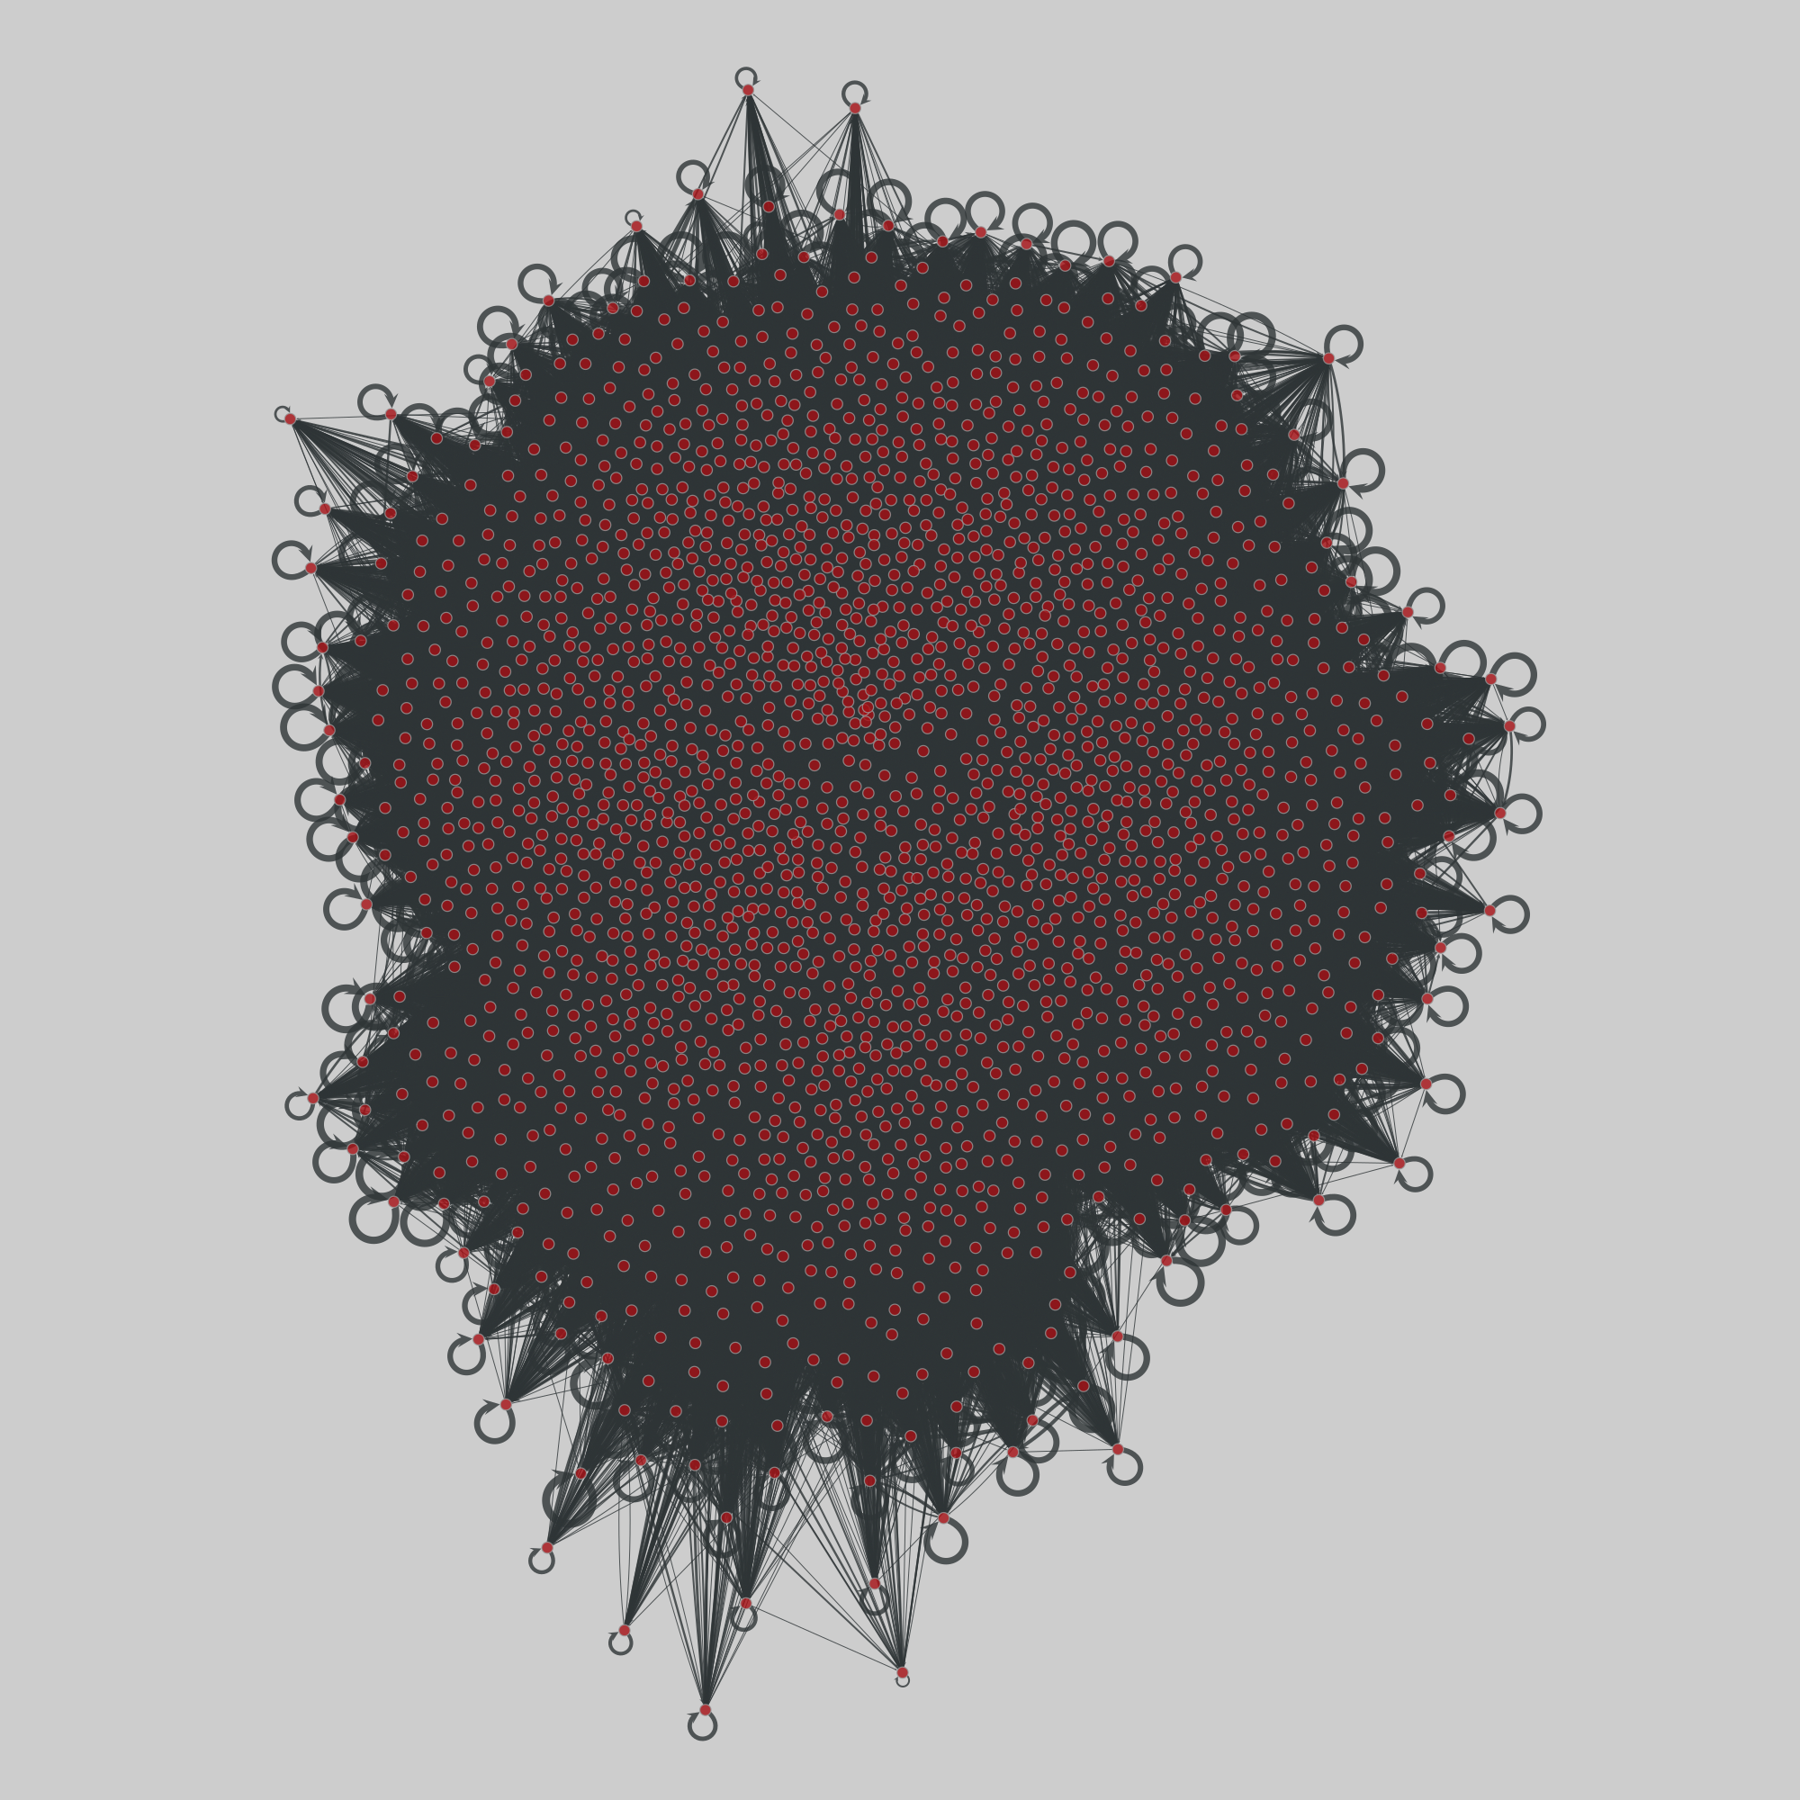
at_migrations: Austrian internal migrations (2002-2022)
A network of migrations between municipalities in Austria, from 2002 to 2022. A weighted directed link from source to target indicates a migration flow from these two municipalities. Edges are annotated with migration volume (number of people), nationality, sex, and year.
This network has 2115 nodes and 2908569 edges.
Tags: Social, Economic, Travel, Weighted, Politlcal, Timestamps, Metadata
Organizational Technology Ladders: Remote Work and Generative AI Adoption
Gregor Schubert
https://arxiv.org/abs/2608.11626 https://arxiv.org/pdf/2608.11626 https://arxiv.org/html/2608.11626
arXiv:2608.11626v1 Announce Type: new
Abstract: This study proposes that firms move along an "organizational technology ladder": adopting one technology transforms hiring and work processes and builds skills and organizational capital that change the cost of adopting subsequent technologies. I study how firms' adoption of remote work technology during the COVID-19 period shaped later uptake of generative AI. Using U.S. job-posting data and an instrumental-variables strategy based on predicted differences in labor-market pressure to offer remote work, I estimate that a 10 percentage point increase in remote hiring in 2021-2022 increases the share of job postings mentioning generative AI in 2023-2024 by 0.4 percentage points across firms and 0.7 percentage points across occupations within firms. I provide evidence on mechanisms consistent with a technology-ladder channel: remote work adoption shifts hiring toward technical and managerial capabilities that predict faster conversion of generative AI exposure into adoption. Firms with return-to-office mandates---interpreted as revealing low remote productivity---exhibit a substantially larger response of generative AI adoption to remote work, consistent with an organizational frictions channel.
toXiv_bot_toot
faculty_hiring_us: Faculty hiring networks in the US (2022)
Networks of faculty hiring for all PhD-granting US universities over the decade 2011–2020. Each node is a PhD-granting institution, and a directed edge (i,j) indicates that a person received their PhD from node i and was tenure-track faculty at node j during time of collection (2011-2020). This dataset is divided into separate networks for all 107 fields, as well as aggregate networks for 8 domains, and an overall network for …
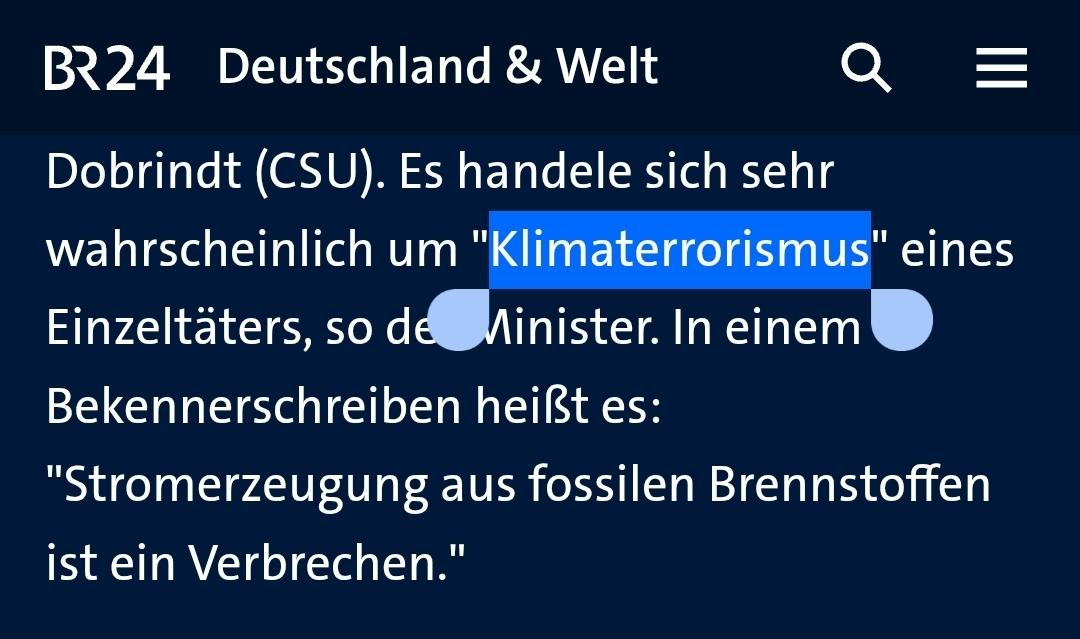
Das Framing "Klima-Extremismus" von Dobrindt verselbständigt sich jetzt. Zahlreiche Medien eskalieren jetzt zum Klimaterrorismus.
Der Begriff "Klimaterroristen" wurde noch 2022 zum Unwort des Jahres gekürt. Die Aktivisten würden damit "kriminalisiert und diffamiert".
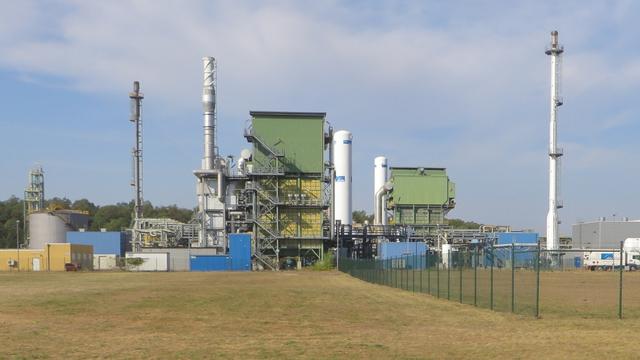
Sicherheitsbedenken, umfangreiche Umbauten und ein Unfall Ende 2025 haben Lindes Produktion von grünem #Wasserstoff im Chemiepark #Leuna um Jahre verzögert.
Der 2021 angekündigte PEM-Elektrolyseur sollte bereits 2022 starten und jährlich rund 3.200 Tonnen Wasserstoff produzieren. Bund und Sa…
 @cdarwin@c.im