 @leftsidestory@mstdn.social
2025-11-13 00:30:02
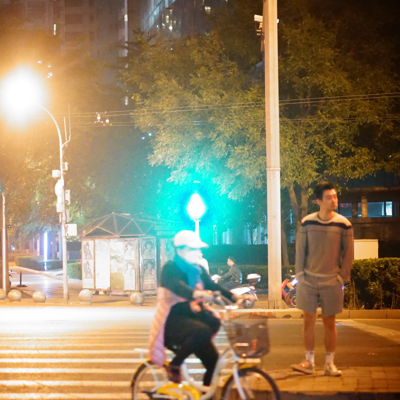
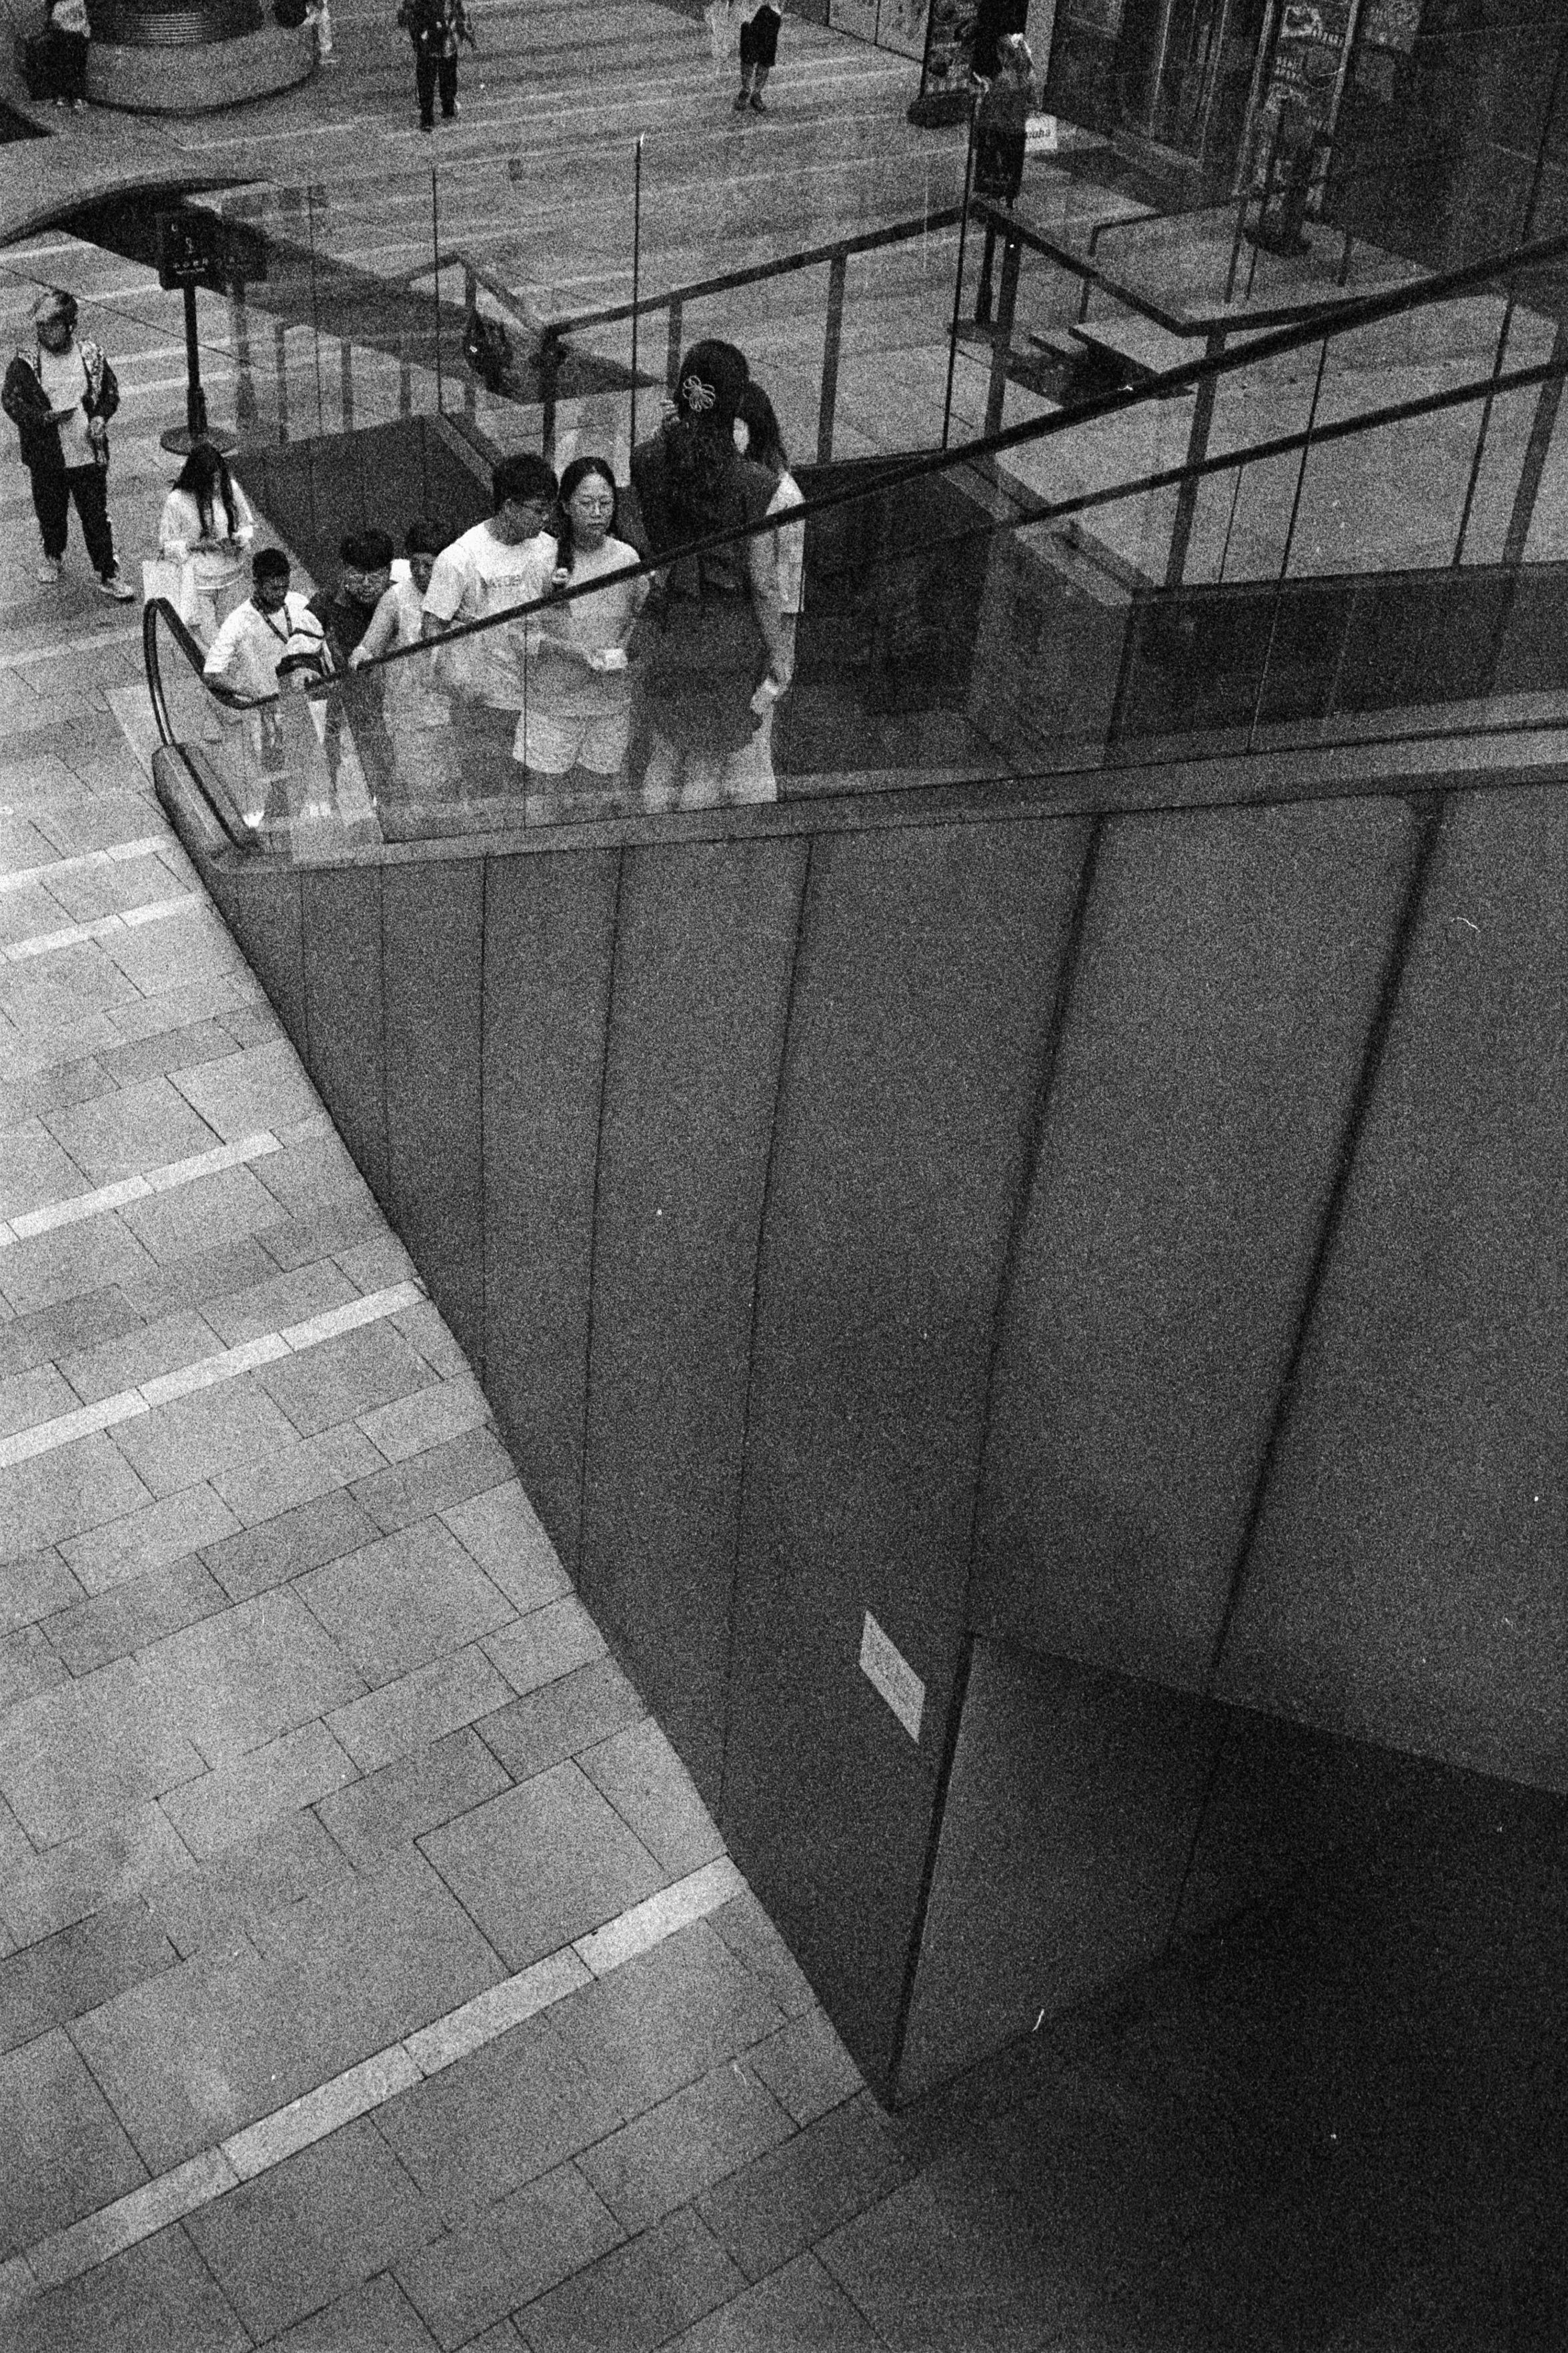
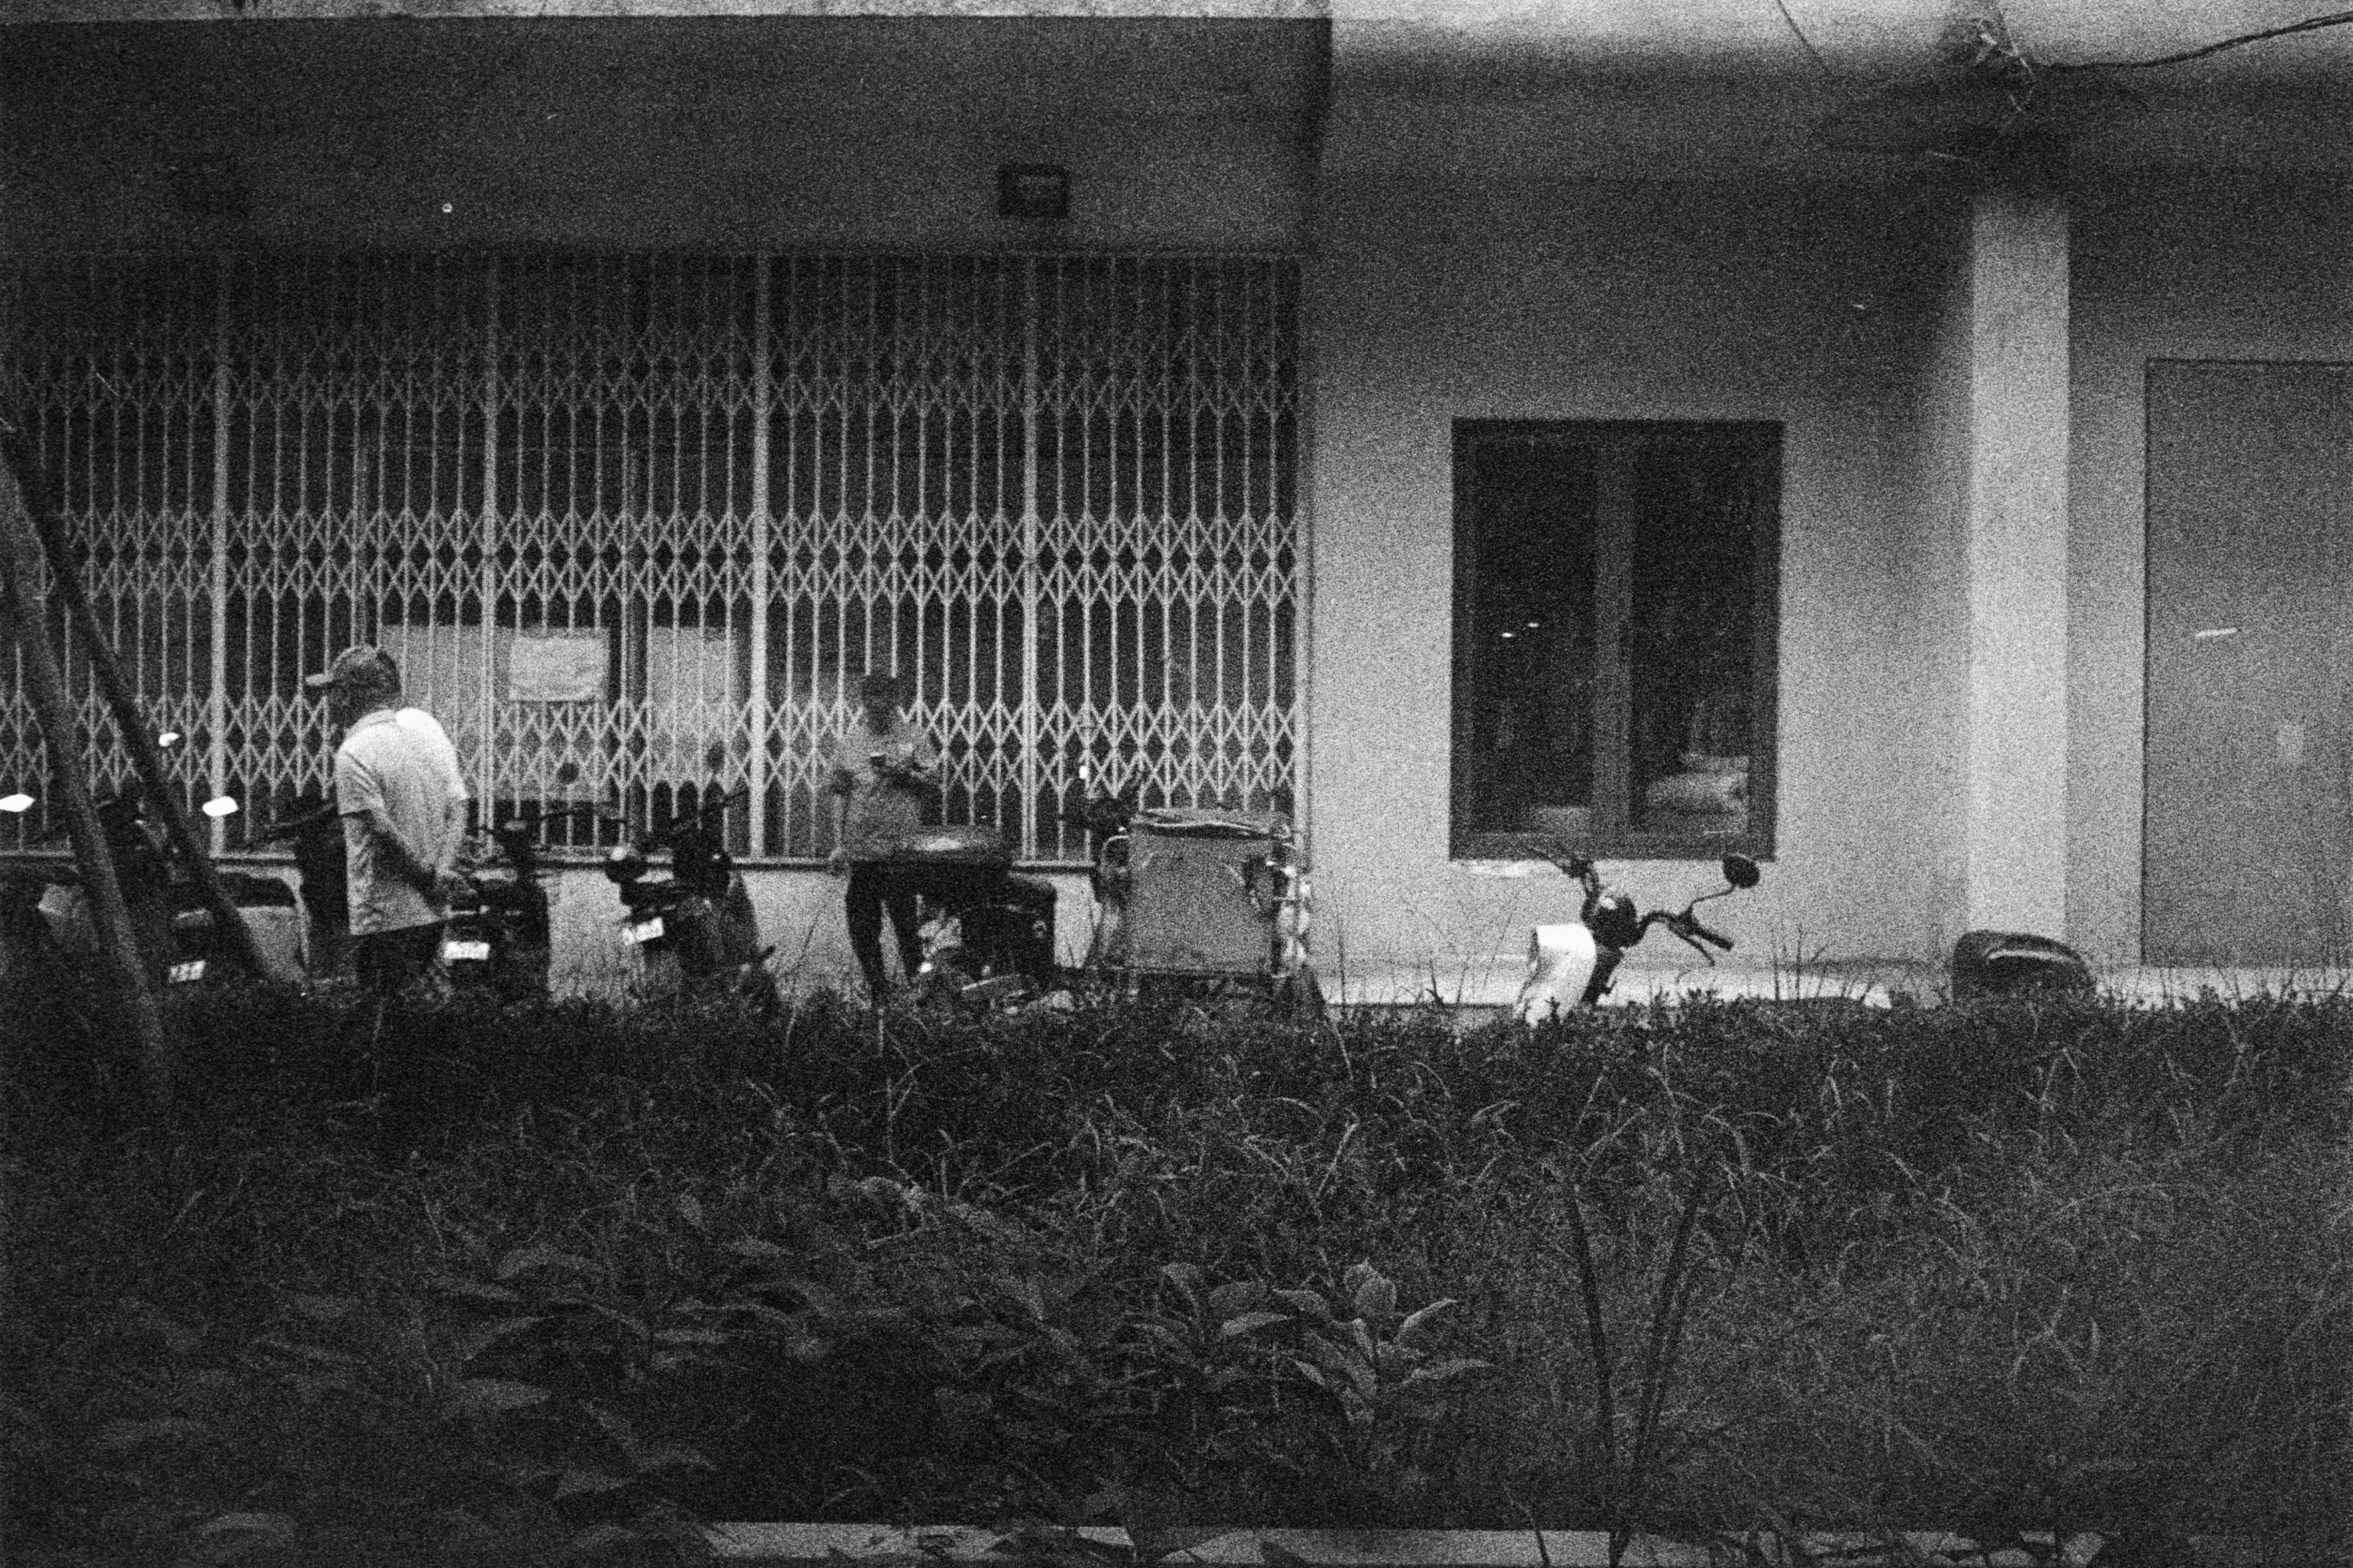
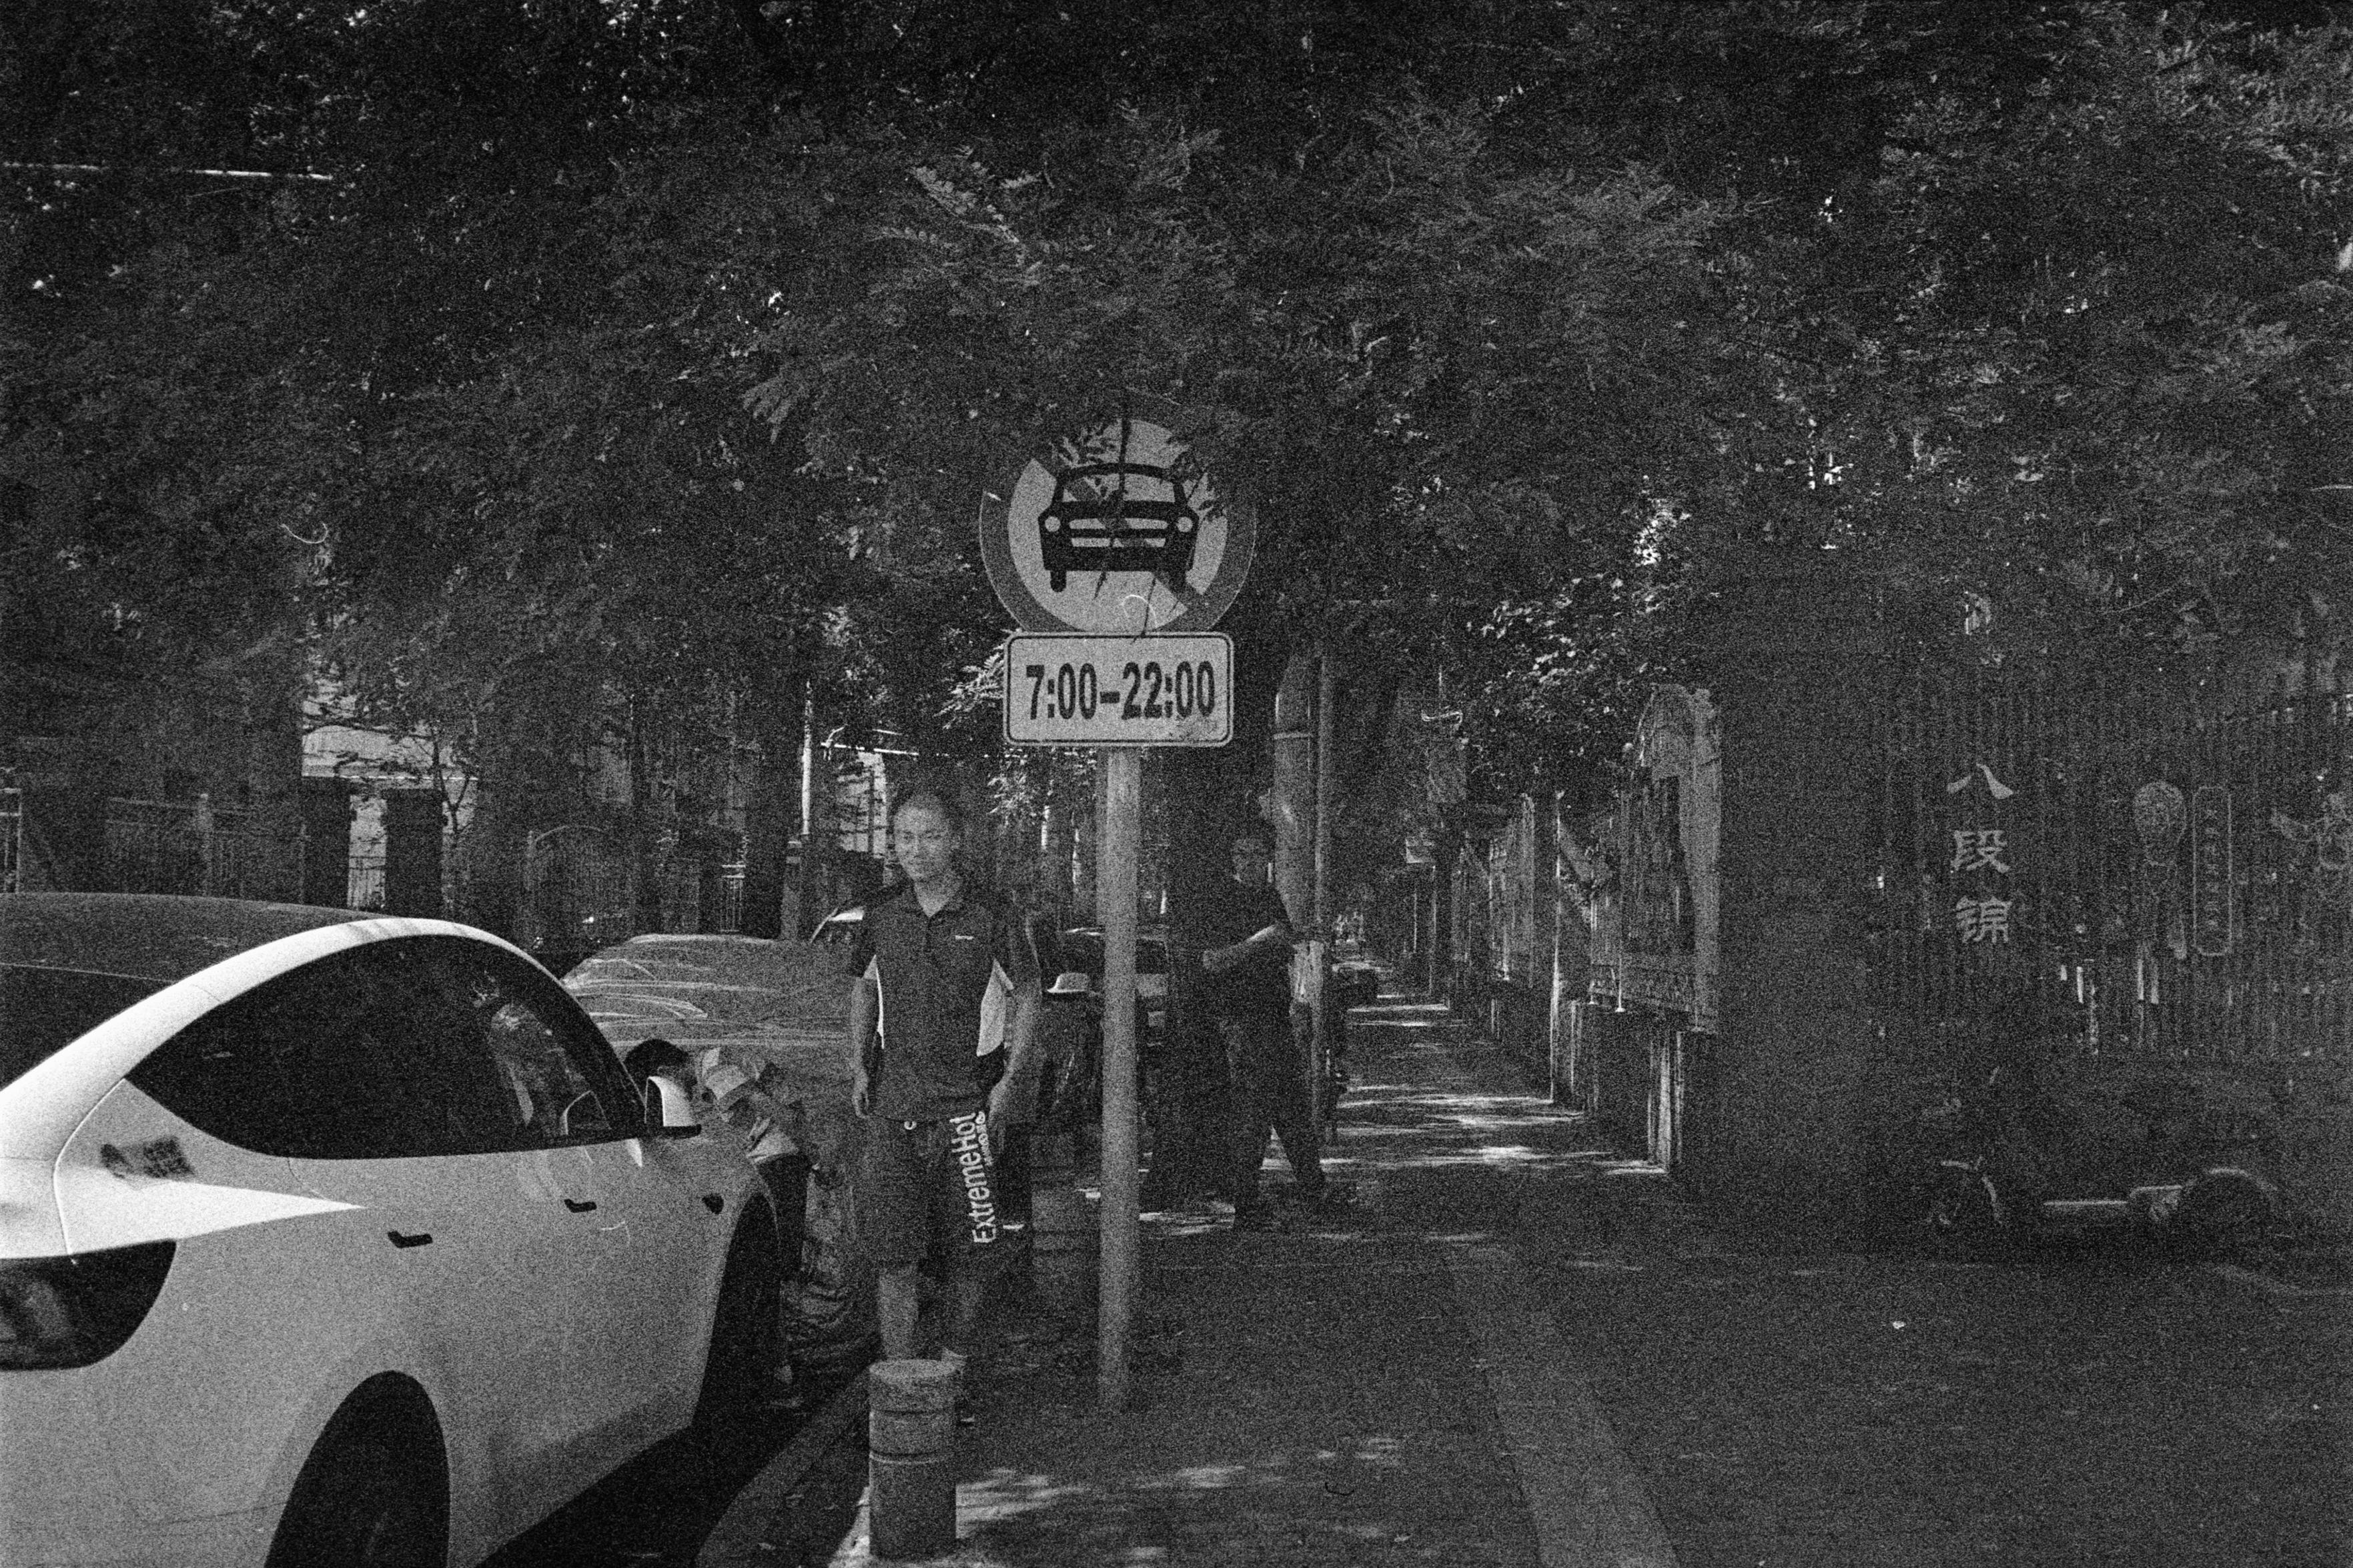
Moody Urbanity - Relations V 🪢
情绪化城市 - 关系 V 🪢
📷 Minolta Hi-Matic AF
🎞️ Shanghai GP3 400 Pan
#filmphotography #Photography #blackandwhite

 @tiotasram@kolektiva.social
2025-10-03 11:09:16
Day 10: Stacey Mason
Another academic, but this time one of my compatriots; we overlapped at UC Santa Cruz as advisees of Michael Mates, and even collaborated on a Twitch stream called ScholarsPlay for a bit, although we never coauthored any papers. We did chat about our research, and I had many good discussions with her about agency in interactive fiction, a topic we both published on. Her paper "On Games and Links: Extending the Vocabulary of Agency and Immersion in Interactive Narratives" (#20AuthorsNoMen
 @arXiv_physicsoptics_bot@mastoxiv.page
2025-09-30 10:04:31
Mid-IR Light Modulators Enabled by Dynamically Tunable Ultra High-Q Silicon Membrane Metasurfaces
Felix Ulrich Brikh, Aleksei Ezerskii, Olesia Pashina, Nikita Glebov, Wenping Yin, Sergey V. Makarov, Mihail Petrov, Ivan Sinev, Hatice Altug
https://arxiv.org/abs/2509.23167
