 @datascience@genomic.social
2026-02-26 11:00:01
@datascience@genomic.social @datascience@genomic.socialIm using case_when() quite a lot, case_match() is new to me: #rstats
@datascience@genomic.socialAdd some swag to your ggplots, with fontawesome symbols and colors: #rstats
@datascience@genomic.socialIf you use Quarto to make presentations for a professional setting, it is important to choose the right theme, e.g. #rstats
@datascience@genomic.socialPolars is a lightning fast DataFrame library/in-memory query engine with parallel execution and cache efficiency. And now you can use is with the tidyverse syntax: #rstats
 @sascha_wolfer@fediscience.org
Try this in #Rstats :
x <- -42
x^2.3
==> NaN ("not a number")
Now try this:
-42^2.3
==> -5413.441
🤯
(adapted from the wonderful 'R Inferno' by Patrick Burns #precedence
@datascience@genomic.social{piggyback} makes it easier to attach large files (e.g. input data) to code in github repos: #rstats
@datascience@genomic.socialTidyX: screencasts explaining different aspects of the R language and the coding process. #rstats
@datascience@genomic.social @datascience@genomic.socialDo you need better performance than what the standard #tidyverse functions have? {collapse} might be worth a look: https://sebkrantz.github.io/collapse/
 @teoten@social.linux.pizza
I could not not share my favorite image of the week... Month... Maybe year, with the #rstats folks over here!
 @Jyoti@mas.to
RE: https://rstats.me/@mdsumner/116148066329334078
Surely just some Play-doh and an old copy of Hustler would have been enough to keep the mad fuck distracted?
 @EgorKotov@datasci.social
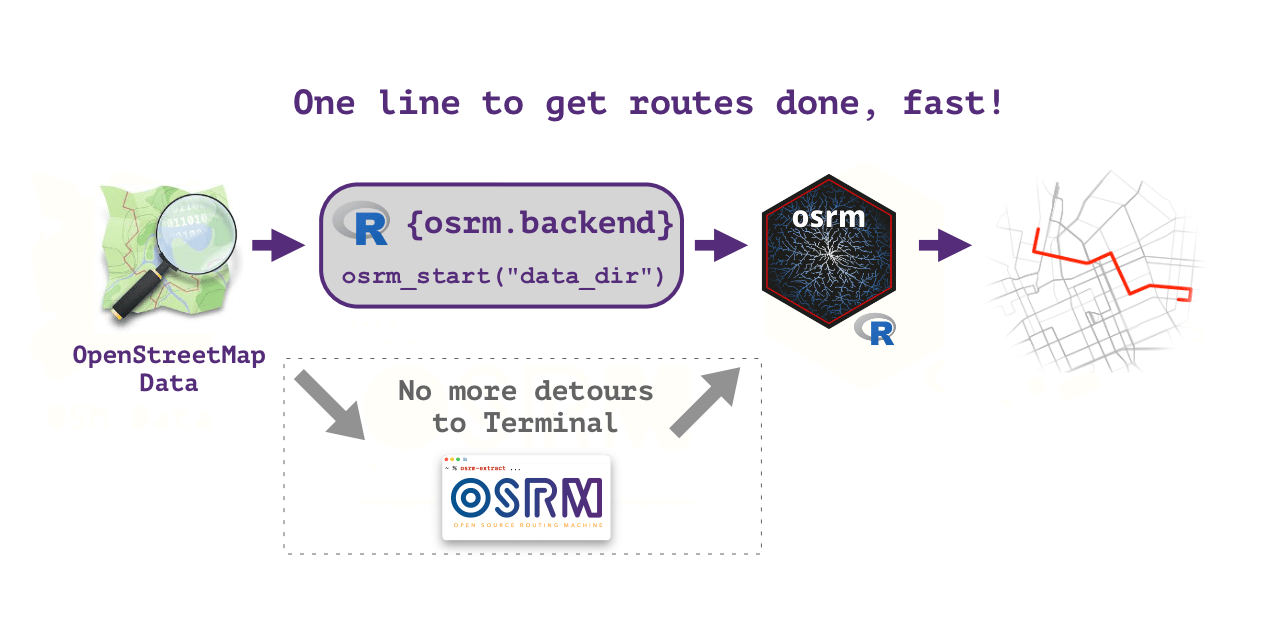
#rstats osrm.backend 0.2 is out.
I fixed a bug that might have caused lockup if you tried to calculate too large origin-destination matrices. Should work just fine now! (though there is a limit of course, as it works over REST API, but parallel requests are your friend).
osrm.backend::osrm_start("data_folder")
- router is installed automagically on all OS
- graph p…
 @erc_bk@fosstodon.org
RE: #rstats
@datascience@genomic.socialWhat They Forgot to Teach You About R: #rstats
@datascience@genomic.socialPrimer to get you started with Optimization and Mathematical Programming in R #rstats
@datascience@genomic.social{purrr} has some lesser known functions that make handling of failing function calls easier: safely, quietly, possibly: #rstats
@erc_bk@fosstodon.orgRE: #rstats
 @datascience@genomic.social
Interactive resizing of picture and table content in Rmd and Quarto: #rstats
@teoten@social.linux.pizza @datascience@genomic.socialThe {conflicted} package makes sure that namespace conflicts are solved explicitly and prevents unpleasent surprises: #rstats
@datascience@genomic.socialAre you making slides with Quarto or R Markdown and need a timer e.g. for breaks or group work? There is the {countdown} package for you: #rstats
@datascience@genomic.social @erc_bk@fosstodon.orgRE: #rstats
@datascience@genomic.social{spiralize} can be used to highlight cyclic data, e.g. multi year time series. #rstats
@datascience@genomic.socialI have a habbit of making (too) many (small) packages for functionality that might be reused in different context. {box} might be an alternative by making scripts into modlues that can be loaded: #RStats
@datascience@genomic.socialLinear programs help to find optimal solutions based on a set of constrains. I used {ompr} before, but the new package {tidyLP} looks promising and integrates with the tidyverse. #rstats #linearprograms #optimization
@datascience@genomic.socialKeynote from rstudio::conf 2022: The past and future of shiny. #rstats
@datascience@genomic.social @datascience@genomic.socialGetting started with Shiny to make interactive web-apps with R: #rstats
@datascience@genomic.socialFollow along when @… walks you through how she tackles a new dataset: https://www.youtube.com/c/JuliaSilge
@datascience@genomic.socialGitHub Actions for the R language: Makes automatic testing of your R package much easier and making sure your package works on different OS and R versions is a matter of just a few lines of yaml: #rstats
@datascience@genomic.socialThe fastverse is a suite of complementary high-performance packages for statistical computing and data manipulation in R. #rstats
@datascience@genomic.socialCustomize what happens when you start R: #rstats #environment
@datascience@genomic.social @datascience@genomic.social{slider} helps with aggregation over (sliding) windows, both index and time period based: #rstats
@datascience@genomic.social{ggblanket}, a wrapper around #ggplot for quick, explorative plots with sensible defaults and less code. https://davidhodge931.github.io/ggblanket/
@datascience@genomic.social @datascience@genomic.social @datascience@genomic.socialA curated list of awesome tools to assist 📦 development in R programming language. #rstats #📦
@datascience@genomic.social @datascience@genomic.social @datascience@genomic.socialThe functions in the {withr} package allow to change your environment temporarily. E.g. create a temp file for a {testthat} test and clean it up afterwards. #rstats
@datascience@genomic.social @datascience@genomic.socialMake sure your code follows a consitent style using the {lintr} package. #rstats
@datascience@genomic.social @datascience@genomic.social @datascience@genomic.social @datascience@genomic.social{annotater}: Annotate package load calls, so we can have an idea of the overall purpose of the libraries we’re loading: #rstats
@datascience@genomic.socialDo you (sometimes) use print() or message() for debugging your code? Next time you can use {icecream} instead: #rstats
@datascience@genomic.social @datascience@genomic.social @datascience@genomic.social @datascience@genomic.socialFunction-oriented Make-like declarative workflows for R #rstats
@datascience@genomic.social{testthat} is great for automatic testing. Here are some tricks for the heavy user: #rstats
@datascience@genomic.socialI am more fluent in LaTeX than in plotmath expression. If you are the same, latex2exp will make your life easier. https://cran.r-project.org/web/packages/latex2exp/vignettes/using-latex2exp.html
@datascience@genomic.social{ivs} makes it easier to work with intervals: #rstats
@datascience@genomic.socialR doesnt need to be a hard and scientific tool 📈. You can use it to make art 🎨: #rstats
@datascience@genomic.socialBeside the {report} package (yesterdays note) there are more tools in the easystats collection. #rstats
@datascience@genomic.socialAdd highlighting to your quarto presentation using the RoughNotation library: #rstats
@datascience@genomic.socialAre you interested in how dependency-heavy your (or another) package is and why? #rstats
@datascience@genomic.socialAutomatically describe data and models as text using the {report} package. #rstats
@datascience@genomic.socialTidy Modeling with R: #rstats #machinelearning
@datascience@genomic.socialSometimes (often) one ends up needing to run older versions of R using older versions of packages. Evercran might be just the tool to help with that: #RStats…
@datascience@genomic.socialUsing fonts in R graphics can be tricky at times. {showtext} aims to make it easier: #rstats
@datascience@genomic.social @datascience@genomic.socialExtract tables from pdfs with {tabulapdf} #rstats #datasciece
@datascience@genomic.social @datascience@genomic.social{nplyr} has helper functions to work on nested dataframes: #rstats #datascience
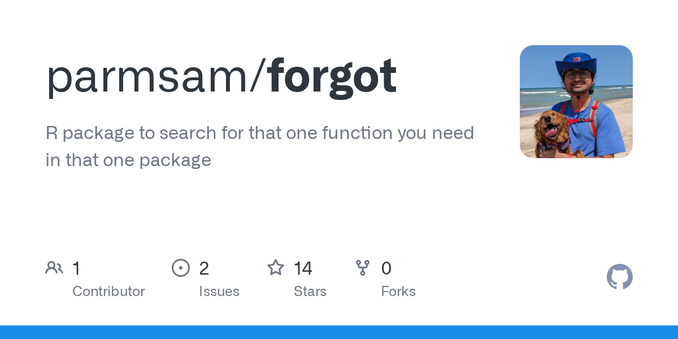
@datascience@genomic.socialIt has happened to the best of us: You forgot the name of a function or the package that function was in but you are sure its there somewhere and does exactly what you need! Introduce {forgot}, it helps you find that function: https://github.com/parmsam/forgot
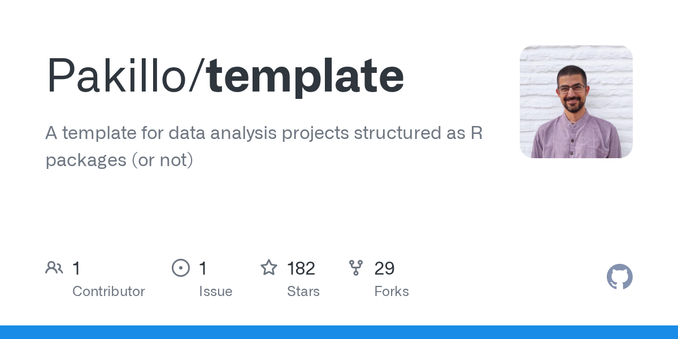
@datascience@genomic.socialA template for data analysis projects structured as R packages (or not) https://github.com/Pakillo/template by @…
@datascience@genomic.socialThere are frameworks like {golem} and {rhino} to make shiny development more robust, but I like the concept of {shinytest2} in providing a testing framework for pure shiny. https://rstudio.github.io/shinytest2/index.html
@datascience@genomic.socialSometimes you get data in less than optimal format, e.g. as a png of a figure 😭... In that case https://cran.r-project.org/web/packages/metaDigitise/vignettes/metaDigitise.html might be the rescue.
@datascience@genomic.socialFind the best contrast between one color and a list of options, e.g. for labels in geom_tile: {prismatic::best_contrast()} https://emilhvitfeldt.github.io/prismatic/reference/best_contrast.html
 @gerald_leppert@bonn.social
#DigitalIndependence #diday for #SocialScience #researchers:
#Rstats #Jamovi #Python <-- #SPSS #Stata
#LibreOffice #LaTeX #Typst editors #Gnumeric <-- #MicrosoftOffice
#CollaboraOnline <-- #GoogleDocs #GoogleWorkspace #Microsoft365
#Zotero <-- #Endnote #Mendeley #Citavi
#ODK #KoboToolbox #LimeSurvey <-- #Qualtrics #SurveyMonkey etc.
#requal #Taguette <-- #MaxQDA #AtlasTI #NVivo
#PoliticalScience #Economics #Statistics #Econometrics #QualitativeResearch #Evaluation #QuantitativeResearch