 @datascience@genomic.social
2025-06-06 10:00:01
@datascience@genomic.social @datascience@genomic.social @datascience@genomic.socialI have a habbit of making (too) many (small) packages for functionality that might be reused in different context. {box} might be an alternative by making scripts into modlues that can be loaded: #RStats
 @EgorKotov@datasci.social
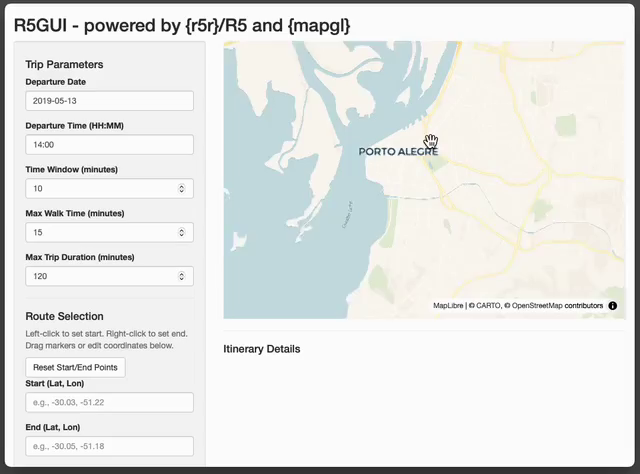
#Accessibility modelers using #r5r #rstats, check this GUI for playing around with R5 network. If many people find it useful, I would get signal if I should invest any more free time into it.
 @datascience@genomic.social
Are you making slides with Quarto or R Markdown and need a timer e.g. for breaks or group work? There is the {countdown} package for you: #rstats
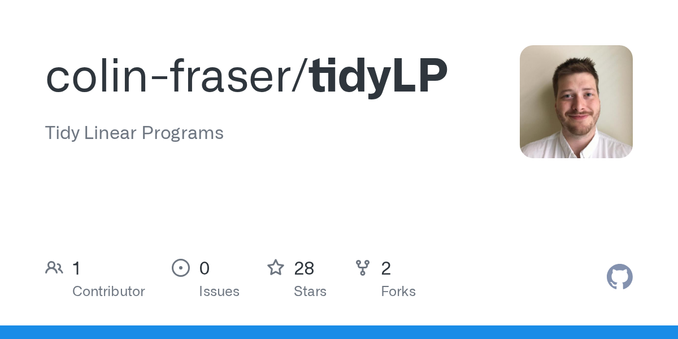
@datascience@genomic.socialLinear programs help to find optimal solutions based on a set of constrains. I used {ompr} before, but the new package {tidyLP} looks promising and integrates with the tidyverse. #rstats #linearprograms #optimization
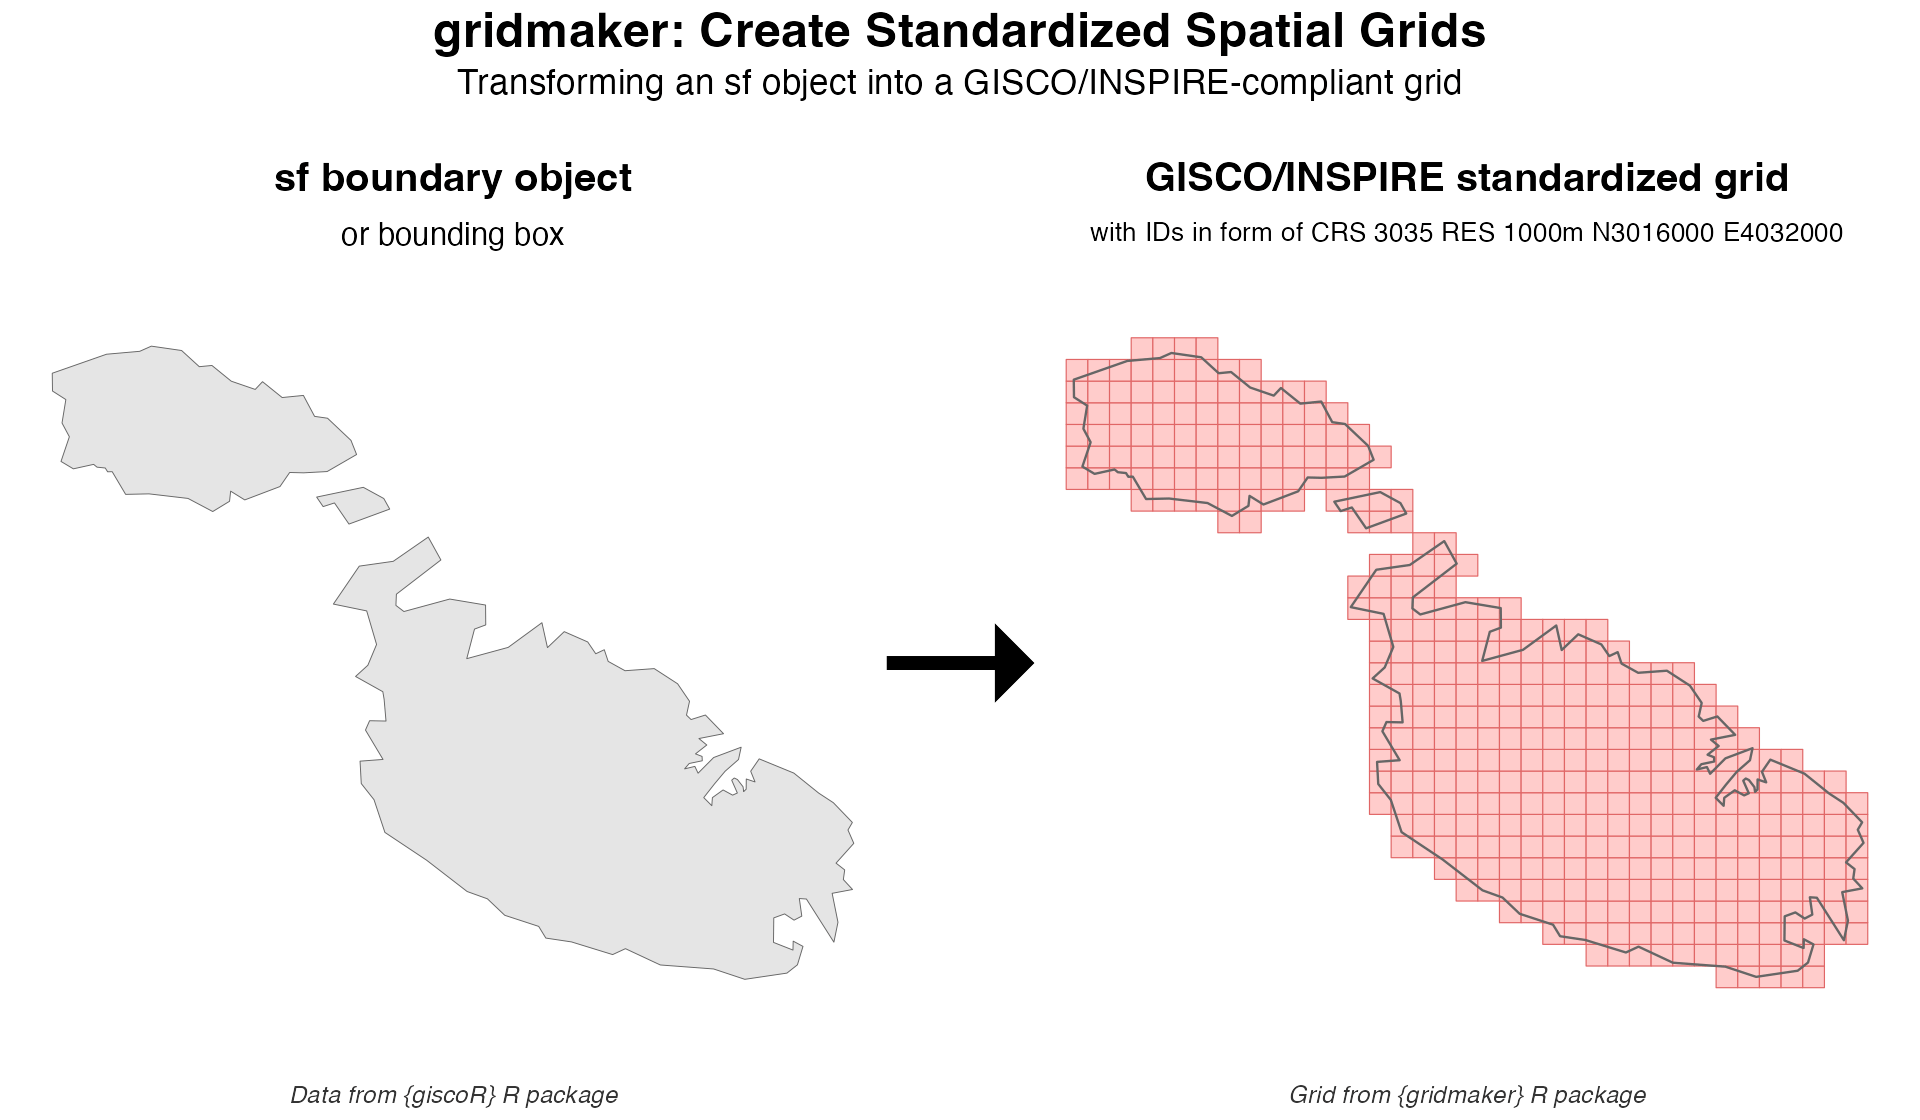
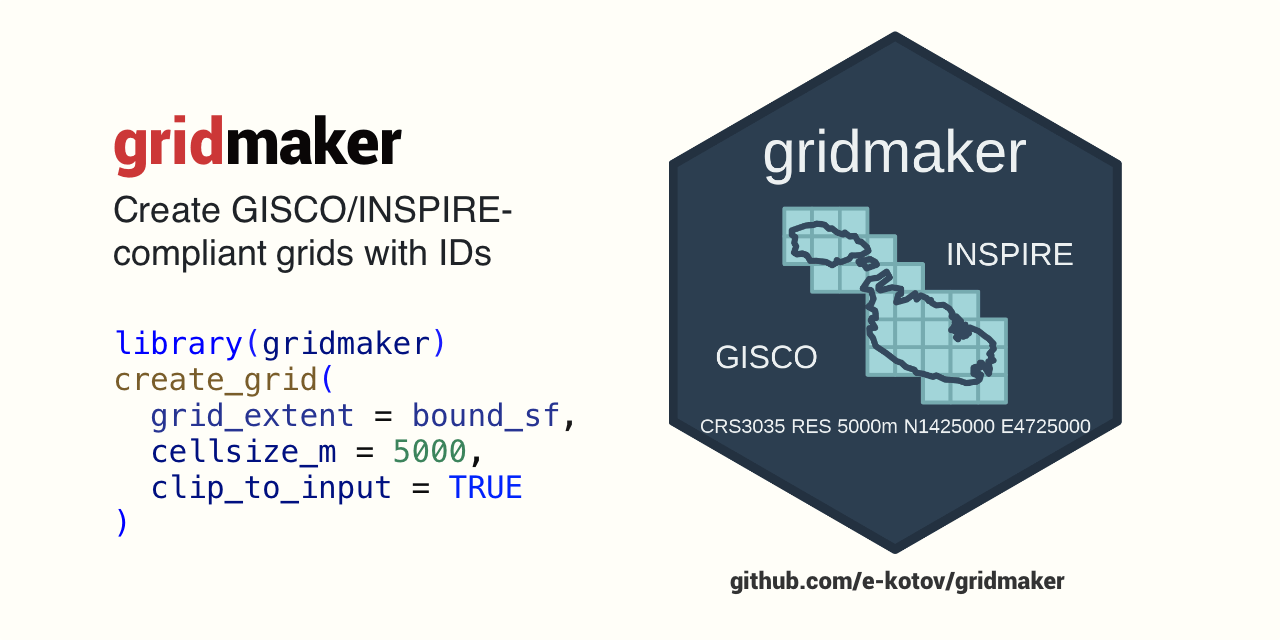
@EgorKotov@datasci.socialNew #rstats https://github.com/e-kotov/gridmaker Creates Eurostat GISCO compatible and INSPIRE-compliant grids with IDs that look like ‘CRS3035RES1000mN3497000E4448000’ or ‘1kmN3497E4447’. Input can be sf, or …
 @datascience@genomic.social @datascience@genomic.social
Getting started with Shiny to make interactive web-apps with R: #rstats
@datascience@genomic.socialGitHub Actions for the R language: Makes automatic testing of your R package much easier and making sure your package works on different OS and R versions is a matter of just a few lines of yaml: #rstats
 @sascha_wolfer@fediscience.org
 @HeidiSeibold@fosstodon.org
We're making hand-made buttons/pins for the @… booth at @…
Any ideas for good motifs anyone?
#rstats
@datascience@genomic.social{spiralize} can be used to highlight cyclic data, e.g. multi year time series. #rstats
 @volephd@fediscience.org @datascience@genomic.social @EgorKotov@datasci.social
 @chpietsch@fedifreu.de
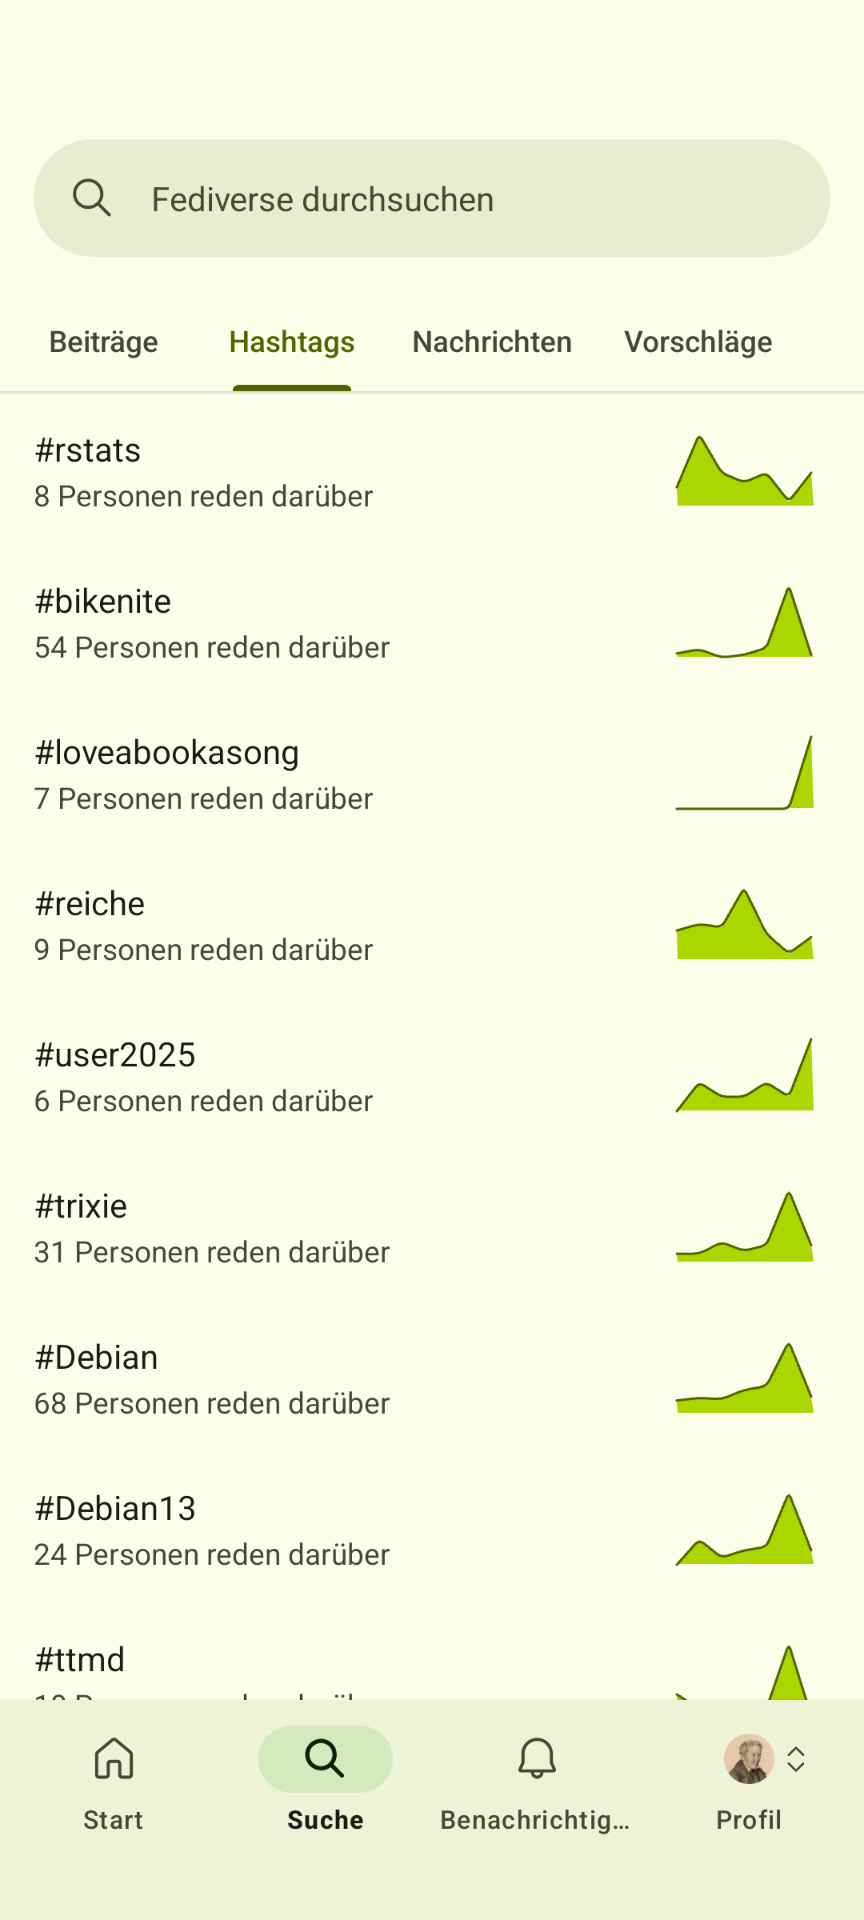
Und wie nerdig ist eure Fediverse-Instanz?
 @datascience@genomic.social
The dbcooper package turns a database connection into a collection of functions. #rstats
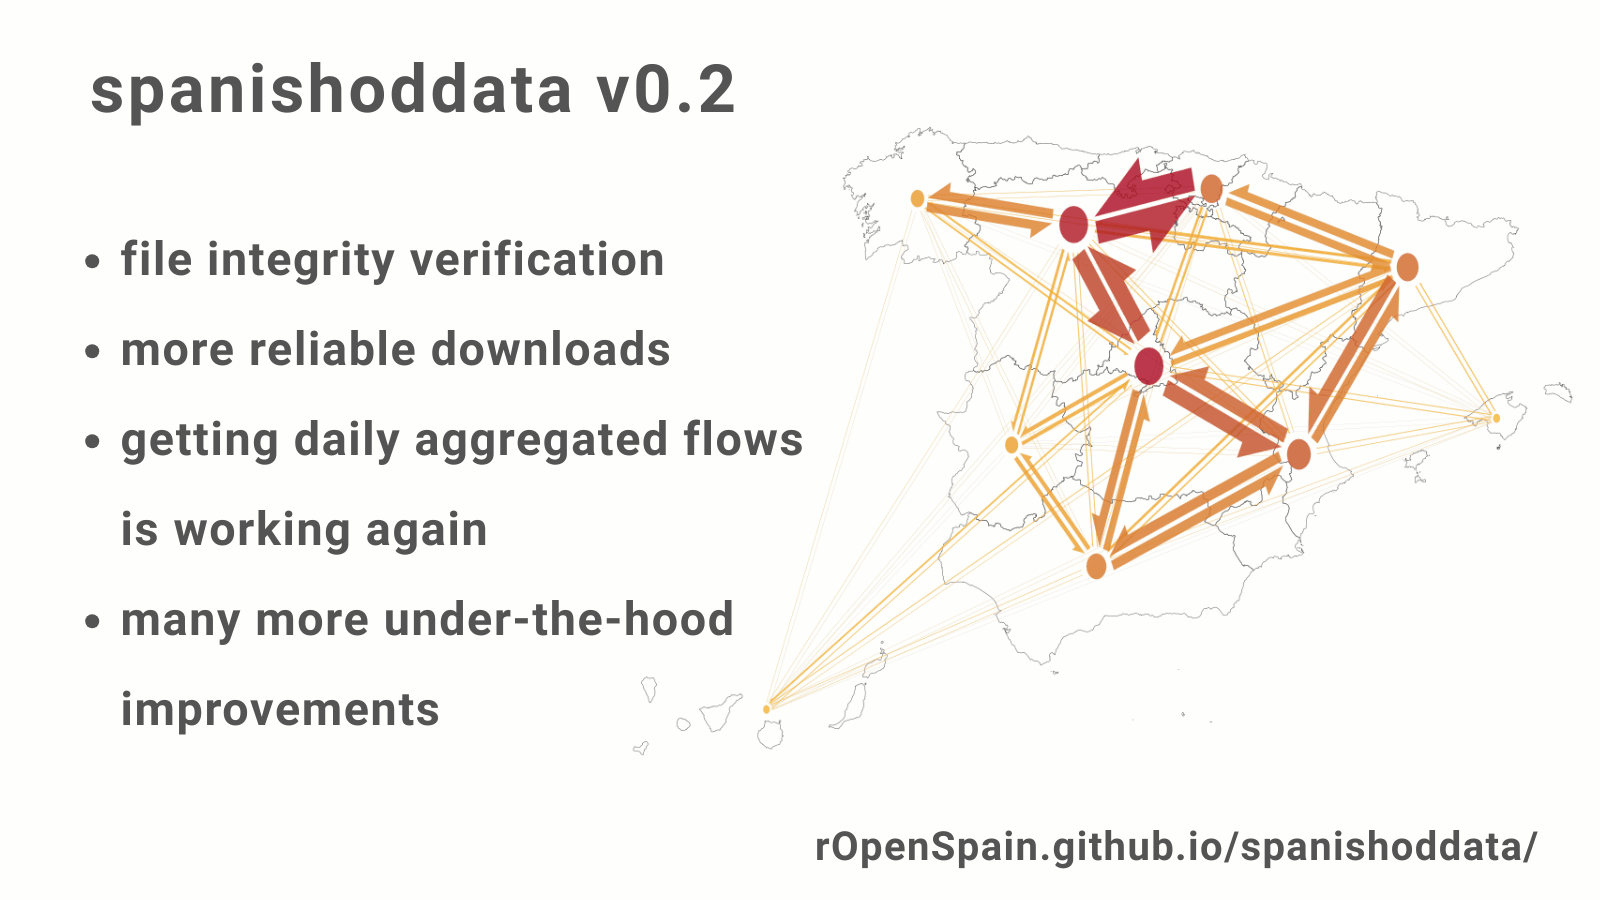
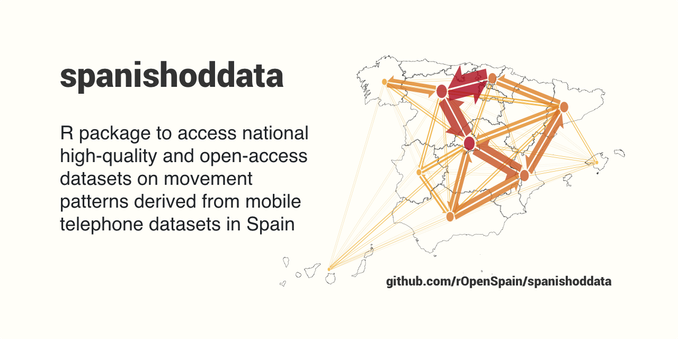
@EgorKotov@datasci.socialHere's an ad that Google Opal created for #rstats #spanishoddata https://ropenspain.github.io/spanishod
@datascience@genomic.socialThe fastverse is a suite of complementary high-performance packages for statistical computing and data manipulation in R. #rstats
@EgorKotov@datasci.socialHere's an ad that Google Opal created for #rstats #spanishoddata https://ropenspain.github.io/spanishod
 @datascience@genomic.social
Customize what happens when you start R: #rstats #environment
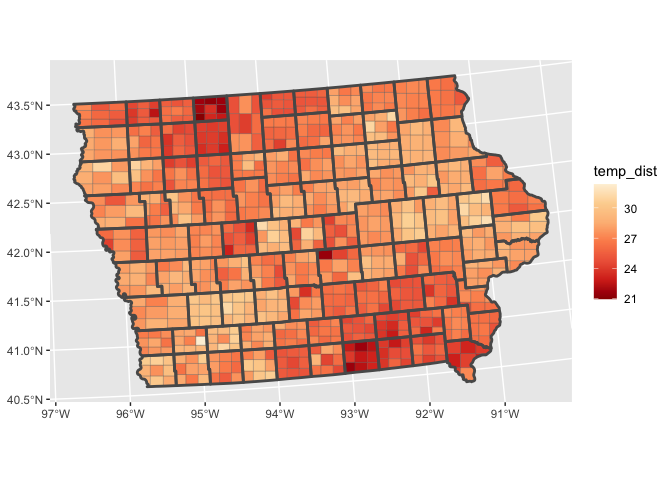
@datascience@genomic.social{slider} helps with aggregation over (sliding) windows, both index and time period based: #rstats
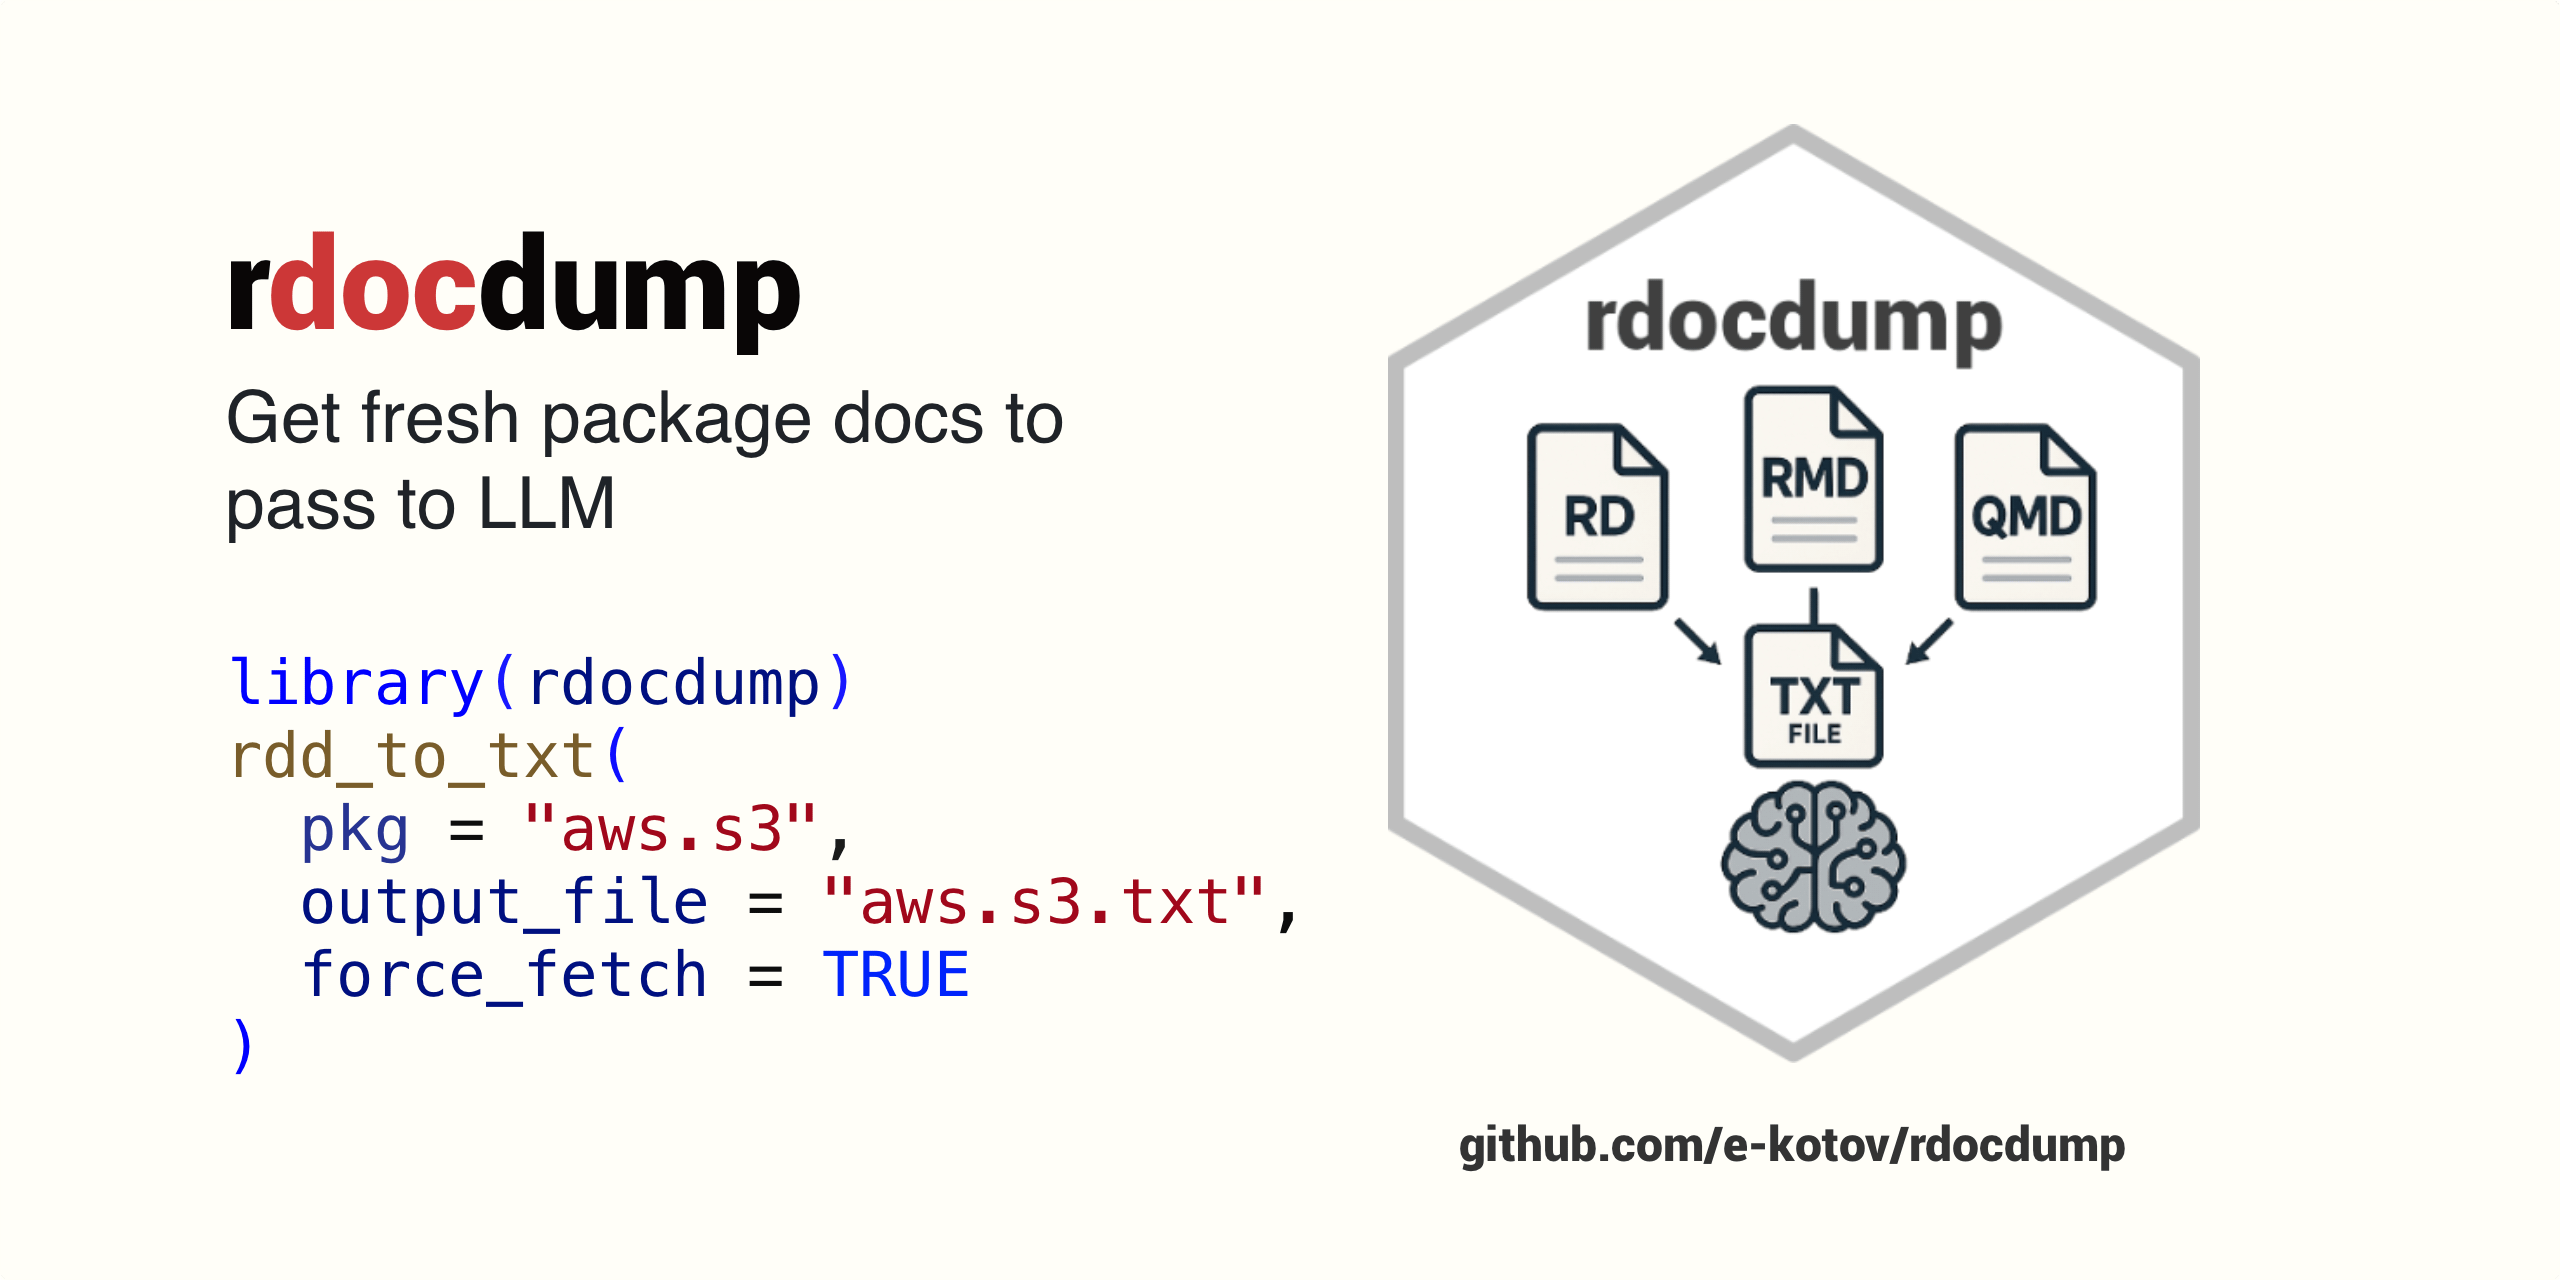
@datascience@genomic.social @EgorKotov@datasci.social📝🗃️ 𝗿𝗱𝗼𝗰𝗱𝘂𝗺𝗽: Dump ‘R’ Package Source, Documentation, and Vignettes into One File for use in LLMs #rstats #LLM is on CRAN https://www.ekotov.pro/rdocdum…
 @datascience@genomic.social @datascience@genomic.social @datascience@genomic.social @datascience@genomic.social @EgorKotov@datasci.social @datascience@genomic.social
A curated list of awesome tools to assist 📦 development in R programming language. #rstats #📦
@datascience@genomic.socialThe functions in the {withr} package allow to change your environment temporarily. E.g. create a temp file for a {testthat} test and clean it up afterwards. #rstats
@datascience@genomic.socialDo you (sometimes) use print() or message() for debugging your code? Next time you can use {icecream} instead: #rstats
@datascience@genomic.socialI am more fluent in LaTeX than in plotmath expression. If you are the same, latex2exp will make your life easier. https://cran.r-project.org/web/packages/latex2exp/vignettes/using-latex2exp.html
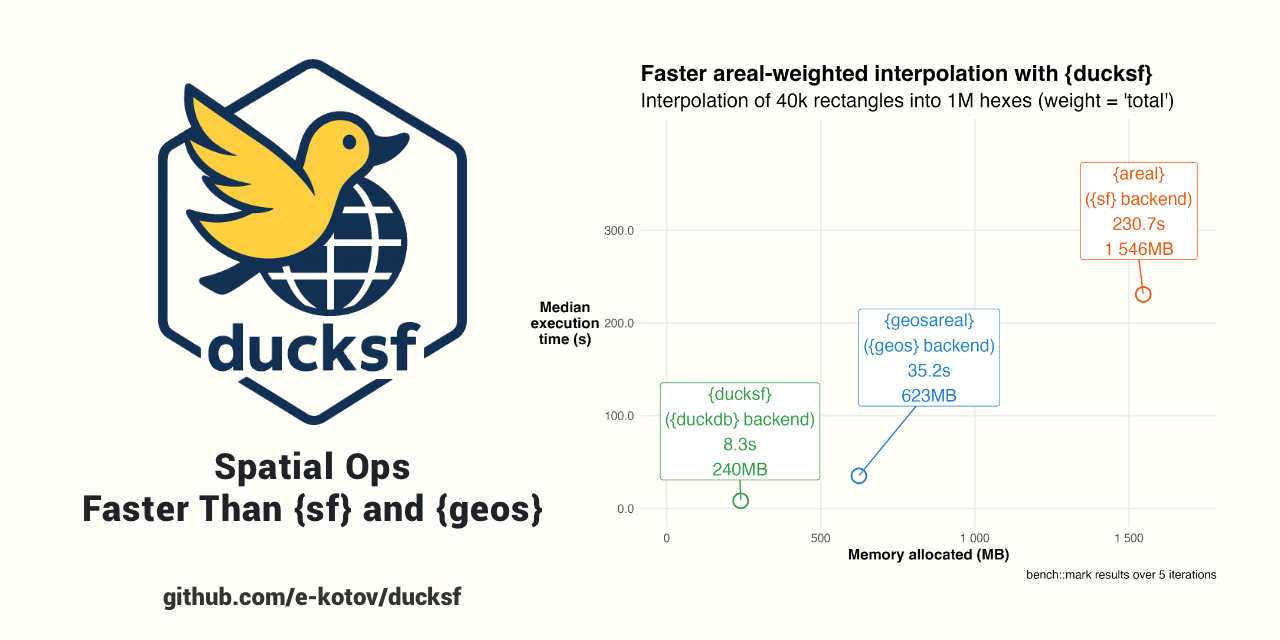
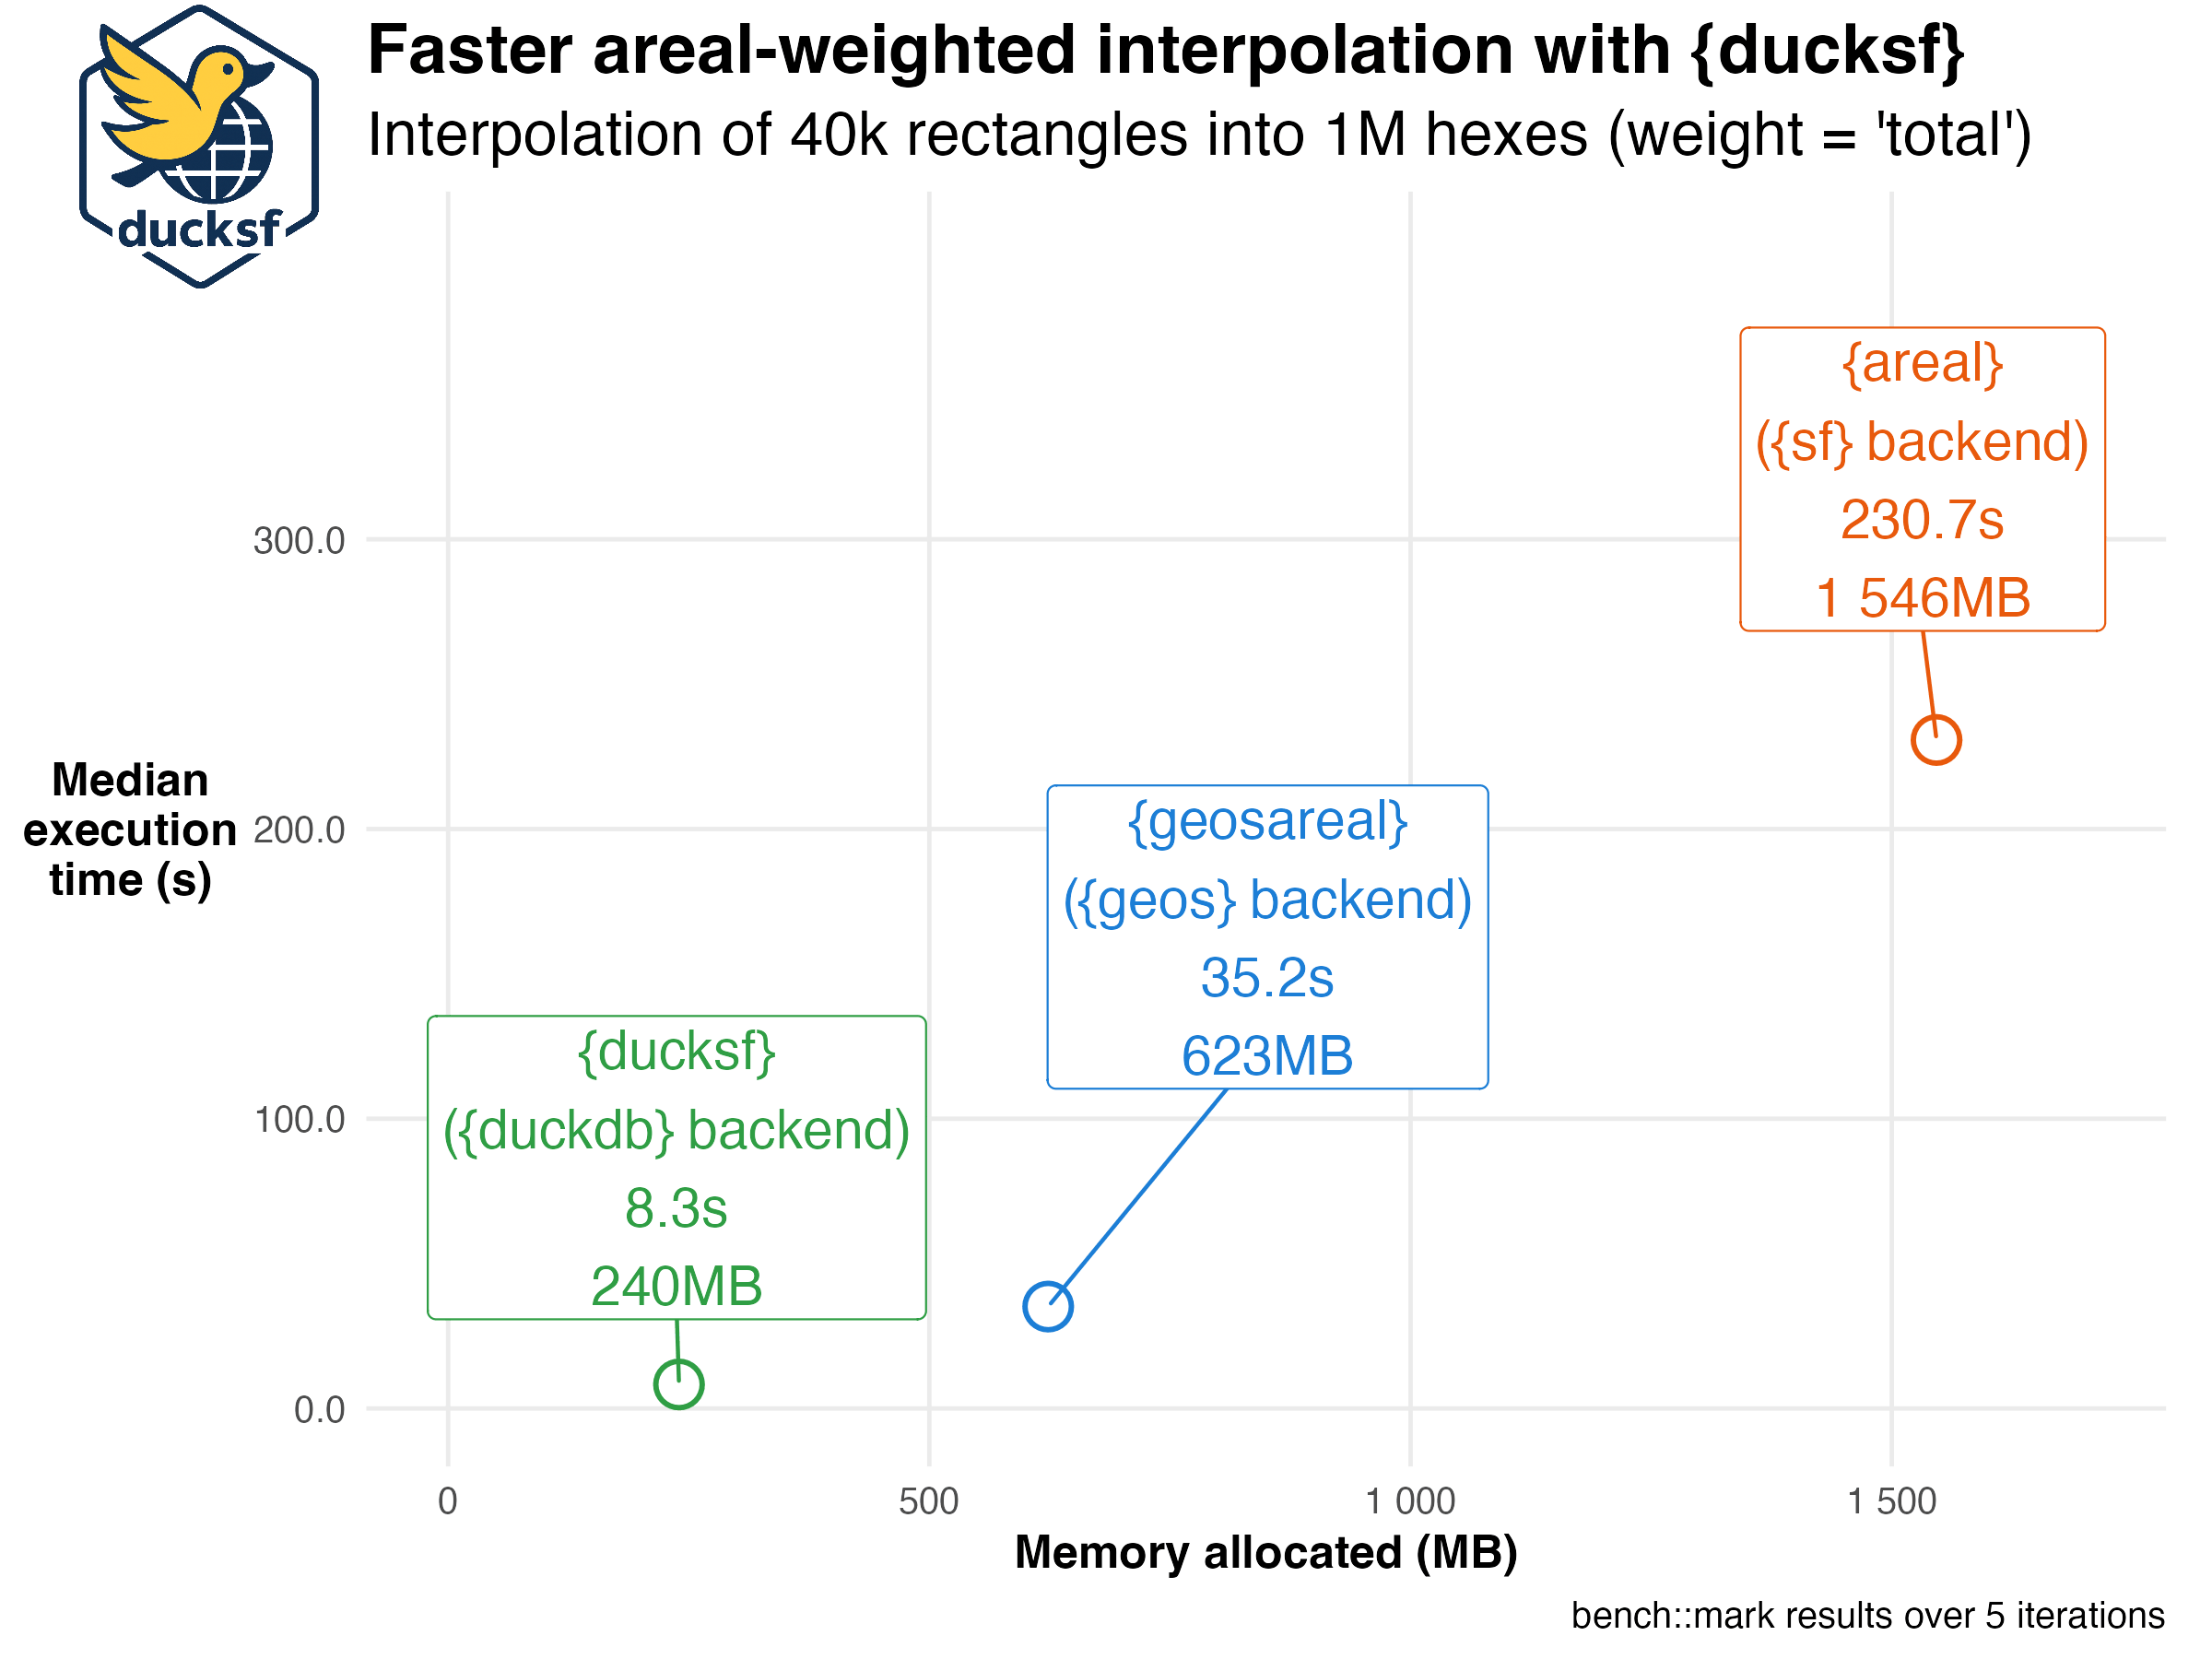
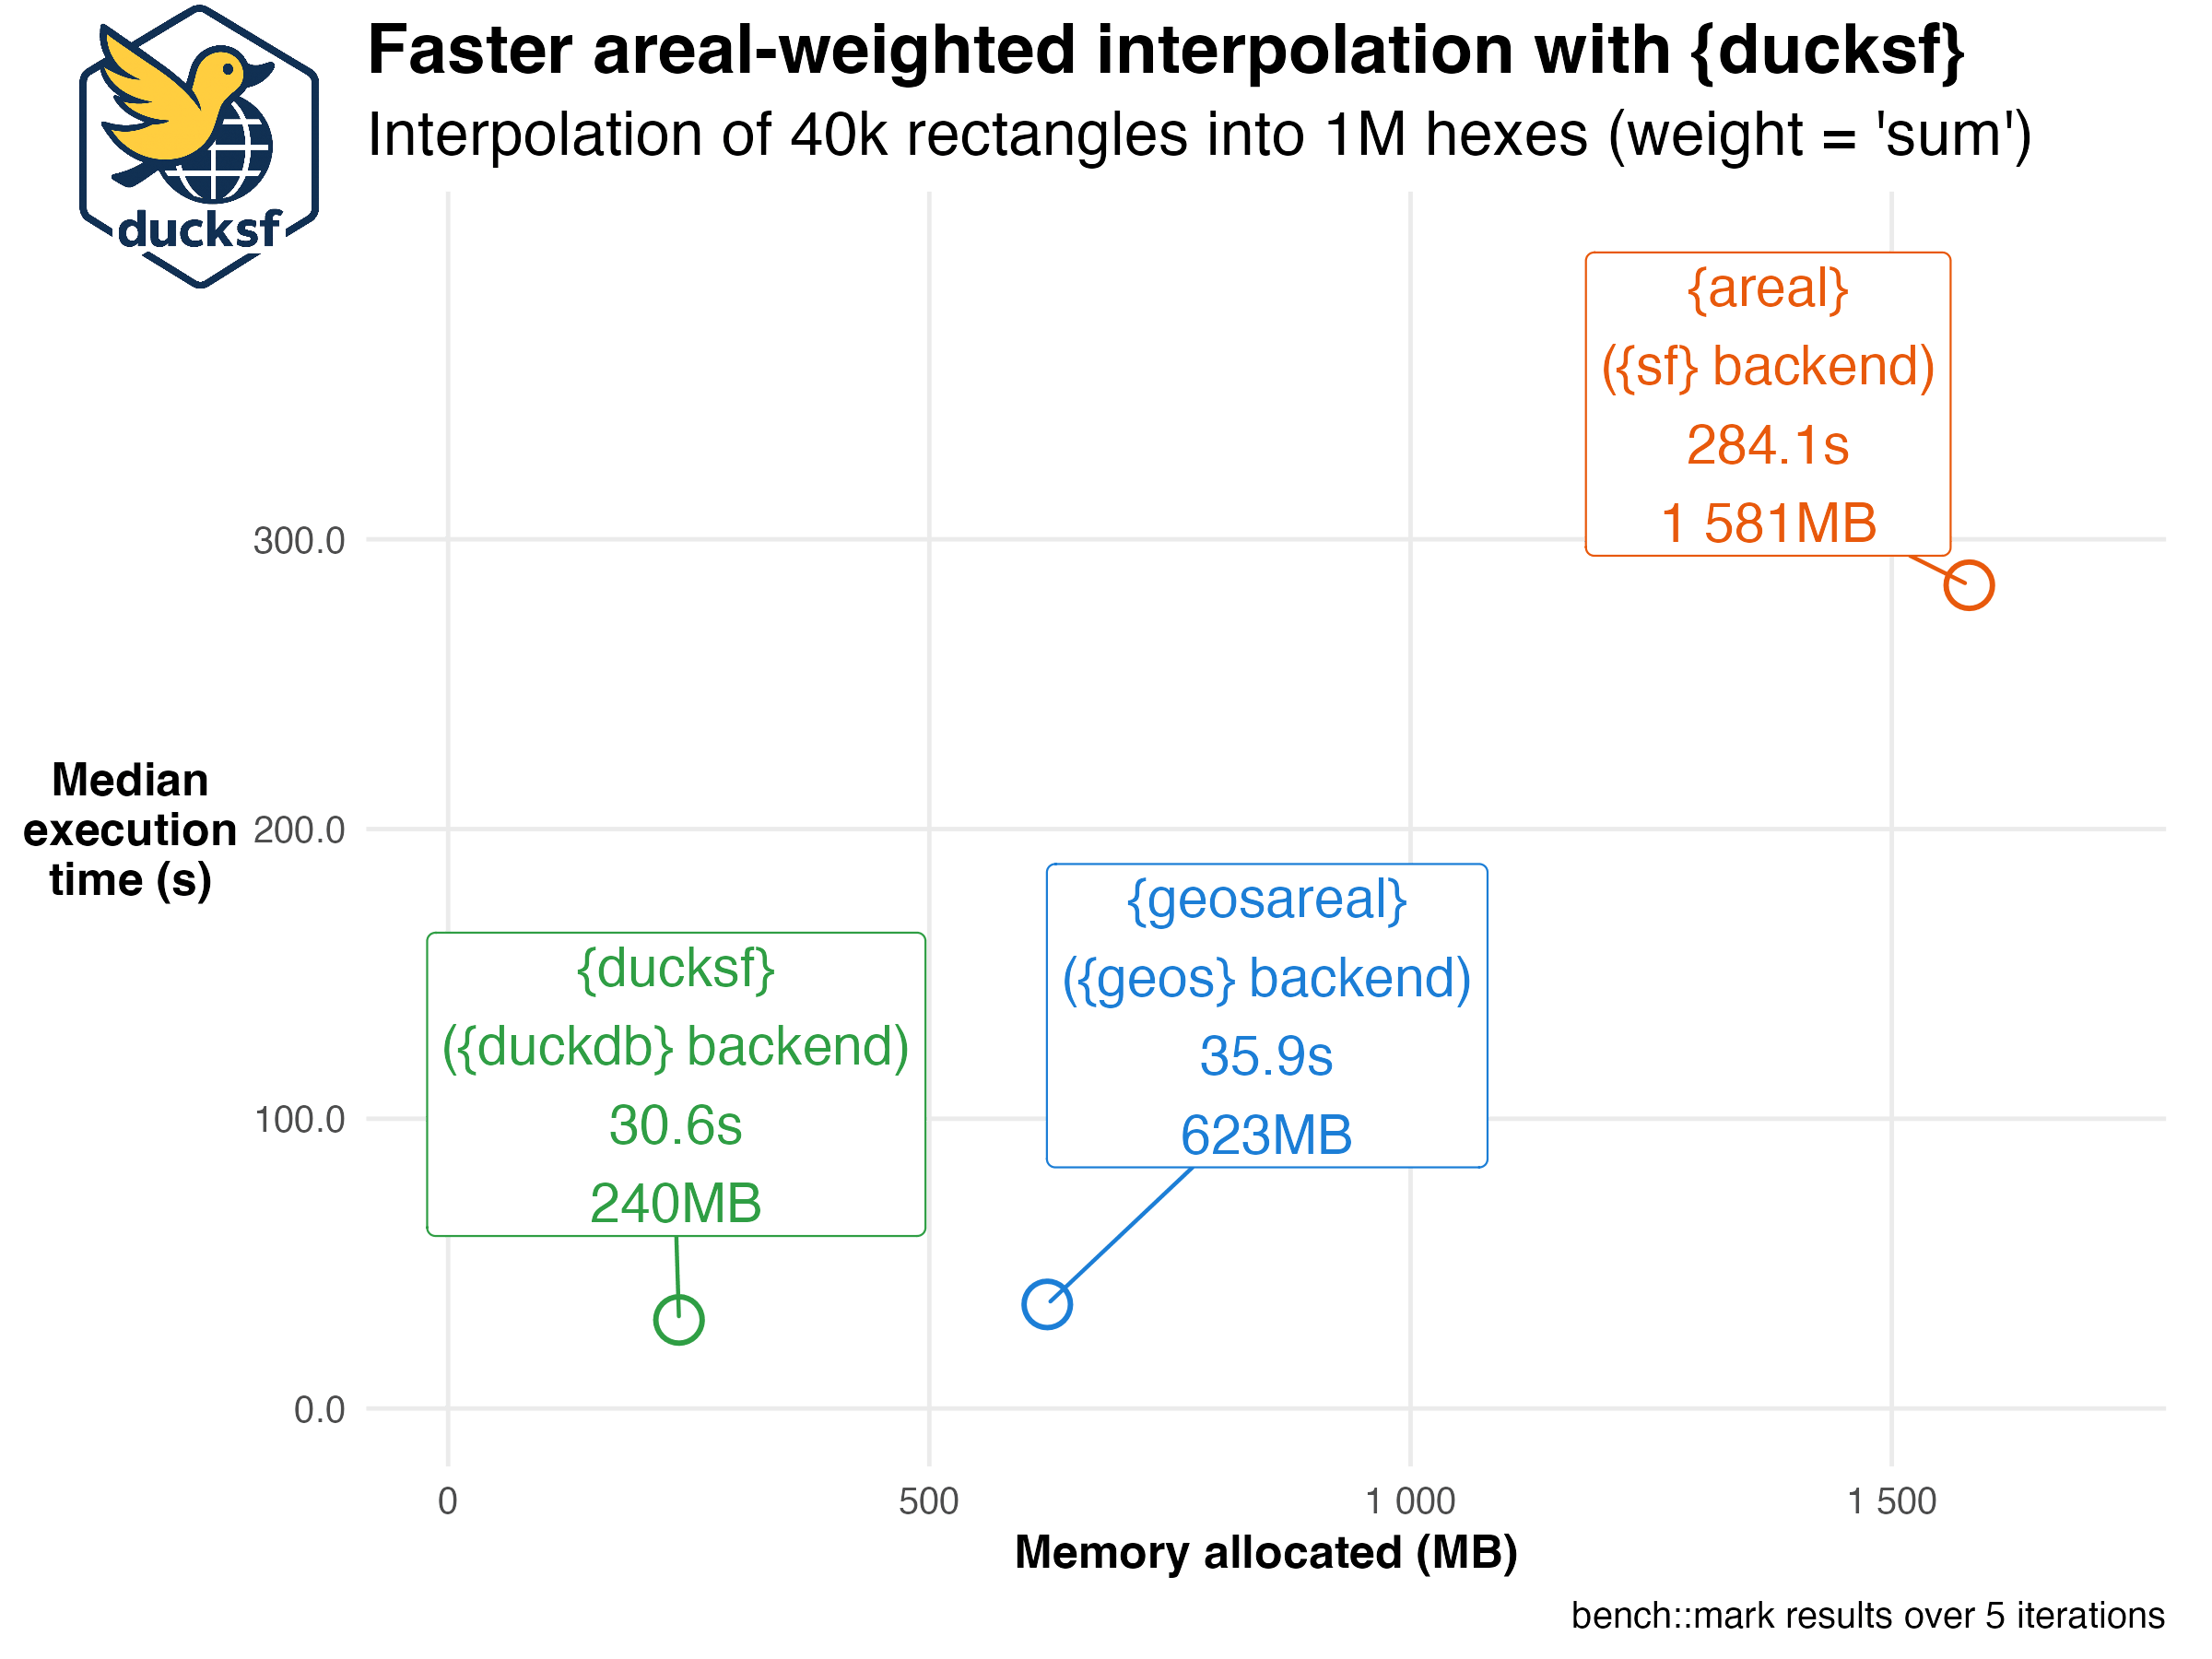
@EgorKotov@datasci.socialGet 9-30x speed doing areal-weighted interpolation with my new {𝐝𝐮𝐜𝐤𝐬𝐟} #rstats package compared to {sf}/{areal}. Experimental, but tested against both {areal} and {sf}. https://github.com/e-kotov/ducksf . Despite…
 @datascience@genomic.social
The {purrr} package is a powerfull way to replace loops. The {furrr} package takes this approach one step further by parallel execution: #rstats
@datascience@genomic.social{annotater}: Annotate package load calls, so we can have an idea of the overall purpose of the libraries we’re loading: #rstats
@datascience@genomic.social @datascience@genomic.socialMake sure your code follows a consitent style using the {lintr} package. #rstats
@datascience@genomic.social @datascience@genomic.social @datascience@genomic.social @datascience@genomic.social{testthat} is great for automatic testing. Here are some tricks for the heavy user: #rstats
@datascience@genomic.social{ivs} makes it easier to work with intervals: #rstats
@datascience@genomic.socialFunction-oriented Make-like declarative workflows for R #rstats
@datascience@genomic.socialR doesnt need to be a hard and scientific tool 📈. You can use it to make art 🎨: #rstats
@datascience@genomic.socialA template for data analysis projects structured as R packages (or not) #rstats #datascience
@datascience@genomic.socialAdd highlighting to your quarto presentation using the RoughNotation library: #rstats
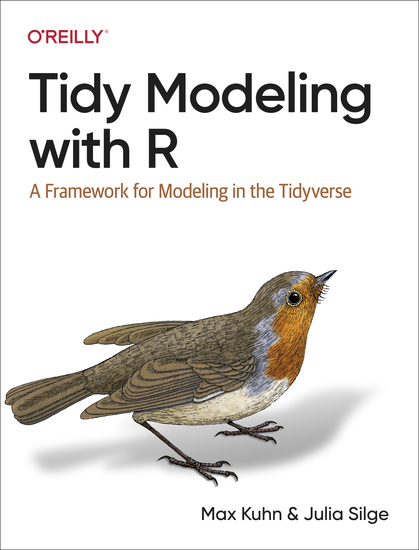
@datascience@genomic.socialTidy Modeling with R: #rstats #machinelearning
@datascience@genomic.socialAre you interested in how dependency-heavy your (or another) package is and why? #rstats
@datascience@genomic.socialExtract tables from pdfs with {tabulapdf} #rstats #datasciece
@datascience@genomic.socialBeside the {report} package (yesterdays note) there are more tools in the easystats collection. #rstats
@datascience@genomic.socialUsing fonts in R graphics can be tricky at times. {showtext} aims to make it easier: #rstats
@datascience@genomic.socialAutomatically describe data and models as text using the {report} package. #rstats
@datascience@genomic.socialNeed some data to test a plot idea or algorithm? On #rstats #synthetic…
@datascience@genomic.social @datascience@genomic.social{nplyr} has helper functions to work on nested dataframes: #rstats #datascience
@datascience@genomic.socialIm using case_when() quite a lot, case_match() is new to me: #rstats
@datascience@genomic.socialPolars is a lightning fast DataFrame library/in-memory query engine with parallel execution and cache efficiency. And now you can use is with the tidyverse syntax: #rstats
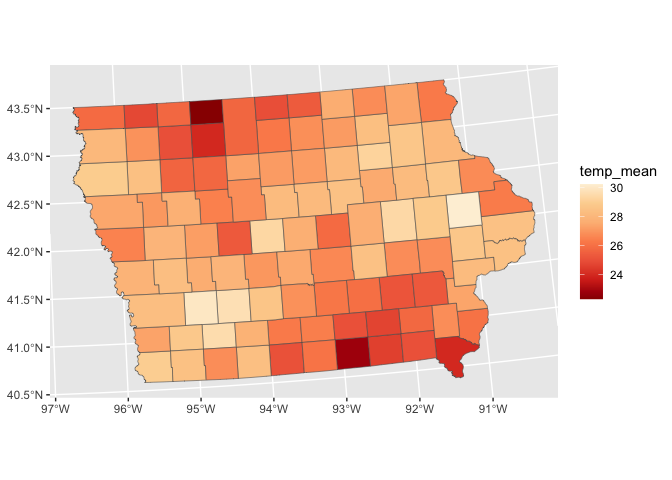
@datascience@genomic.social @datascience@genomic.socialHighlight a certain aspect of your data in ggplot: #rstats
@datascience@genomic.social{piggyback} makes it easier to attach large files (e.g. input data) to code in github repos: #rstats
@datascience@genomic.socialThere are many situations were you need access to different R versions: rig is a way to manage them #rstats
@datascience@genomic.socialIf you use Quarto to make presentations for a professional setting, it is important to choose the right theme, e.g. #rstats
@datascience@genomic.socialNot sure any longer which libraries your script actually needs? #rstats
@datascience@genomic.social @datascience@genomic.socialTidyX: screencasts explaining different aspects of the R language and the coding process. #rstats
@datascience@genomic.social @datascience@genomic.socialSometimes (often) one ends up needing to run older versions of R using older versions of packages. Evercran might be just the tool to help with that: #RStats
@datascience@genomic.social @datascience@genomic.socialSometimes you get data in less than optimal format, e.g. as a png of a figure 😭... In that case https://cran.r-project.org/web/packages/metaDigitise/vignettes/metaDigitise.html might be the rescue.
@datascience@genomic.socialFind the best contrast between one color and a list of options, e.g. for labels in geom_tile: {prismatic::best_contrast()} https://emilhvitfeldt.github.io/prismatic/reference/best_contrast.html
@datascience@genomic.socialDo you need better performance than what the standard #tidyverse functions have? {collapse} might be worth a look: https://sebkrantz.github.io/collapse/
@datascience@genomic.socialFollow along when @… walks you through how she tackles a new dataset: https://www.youtube.com/c/JuliaSilge
@datascience@genomic.social @datascience@genomic.socialPrimer to get you started with Optimization and Mathematical Programming in R #rstats
@datascience@genomic.socialThere are frameworks like {golem} and {rhino} to make shiny development more robust, but I like the concept of {shinytest2} in providing a testing framework for pure shiny. https://rstudio.github.io/shinytest2/index.html